9.1 Introduction
Proper design of a catalytic process for the conversion of any chemical species, including biorenewable molecules, requires accurate knowledge of the rate of the reaction, stability of the catalyst, the influence of reactor configuration, and the potential role of transport phenomena. Each of these reaction engineering concepts will be addressed briefly in this chapter, with each concept illustrated with examples involving biorenewable molecules. The goal of this chapter is to help new researchers to the field avoid common pitfalls in the study of reactions catalyzed by solid materials.
Reaction engineering is a broad field with many excellent textbooks dedicated to both undergraduate and graduate courses in the area. Commonly used textbooks include Elements of Chemical Reaction Engineering by H.S. Fogler [1], Chemical Reaction Engineering by O. Levenspiel [2], Introduction to Chemical Reaction Engineering and Kinetics by R.W. Missen et al. [3], Chemical Reactions and Chemical Reactors by G. Roberts [4], The Engineering of Chemical Reactions by L.D. Schmidt [5], and Chemical Reactor Analysis and Design by G.F. Froment et al. [6]. Many of the concepts in this chapter can be found in the recent book Fundamentals of Chemical Reaction Engineering by Davis and Davis [7], which is currently available as a PDF file free of charge at http://caltechbook.library.caltech.edu/274/.
This chapter is divided into two broad themes, the proper evaluation of the kinetics of catalytic reactions involving biorenewable molecules followed by a discussion of reactor types and transport phenomena that can influence observed reaction kinetics.
9.2 Measurement of Reaction Rates
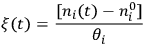
The reaction rate, r, is defined simply as the time derivative of the extent of reaction:

|
9.1 |
where the extent of reaction
 is unique to each reaction, i.e., it does not depend on which species in the reaction you follow:
|
9.2 |
In the expression above, ni is the number of moles and
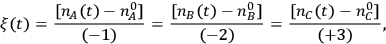
 is the stoichiometric coefficient of species i in the reaction. The superscript 0 refers to the initial amount in the reactor. For example, in the reaction of A and B to form product C according to the following equation:

|
9.3 |
the extent of reaction is calculated by:
|
9.4 |
and the rate is determined by the time derivative of
 . A very common way to evaluate the rate of a reaction is to load the reactants into a batch reactor together with the catalyst and then measure the loss of reactants or the formation of products over time. A hypothetical plot of the amount of C produced with time after charging 1 mole of A and 2 moles of B to a batch reactor can be found in Figure 9.1. The rate is calculated from the initial slope of the curve divided by the stoichiometric coefficient of the product, which in this case is +3. The rate determined from the slope of a reaction profile at an early time is called an “initial” rate because it will generally decrease as reactants are consumed. Therefore, a rate is specific to a particular set of reaction conditions (concentrations, partial pressures, and temperature) at which it is evaluated. Many researchers unfortunately report product yields instead of rates or reaction profiles. For example, some papers would describe the yield of product C in Figure 9.1 as approximately 99% after 2 hours, which does nothing to help quantify the rate since the yield after 1 hour is nearly the same.
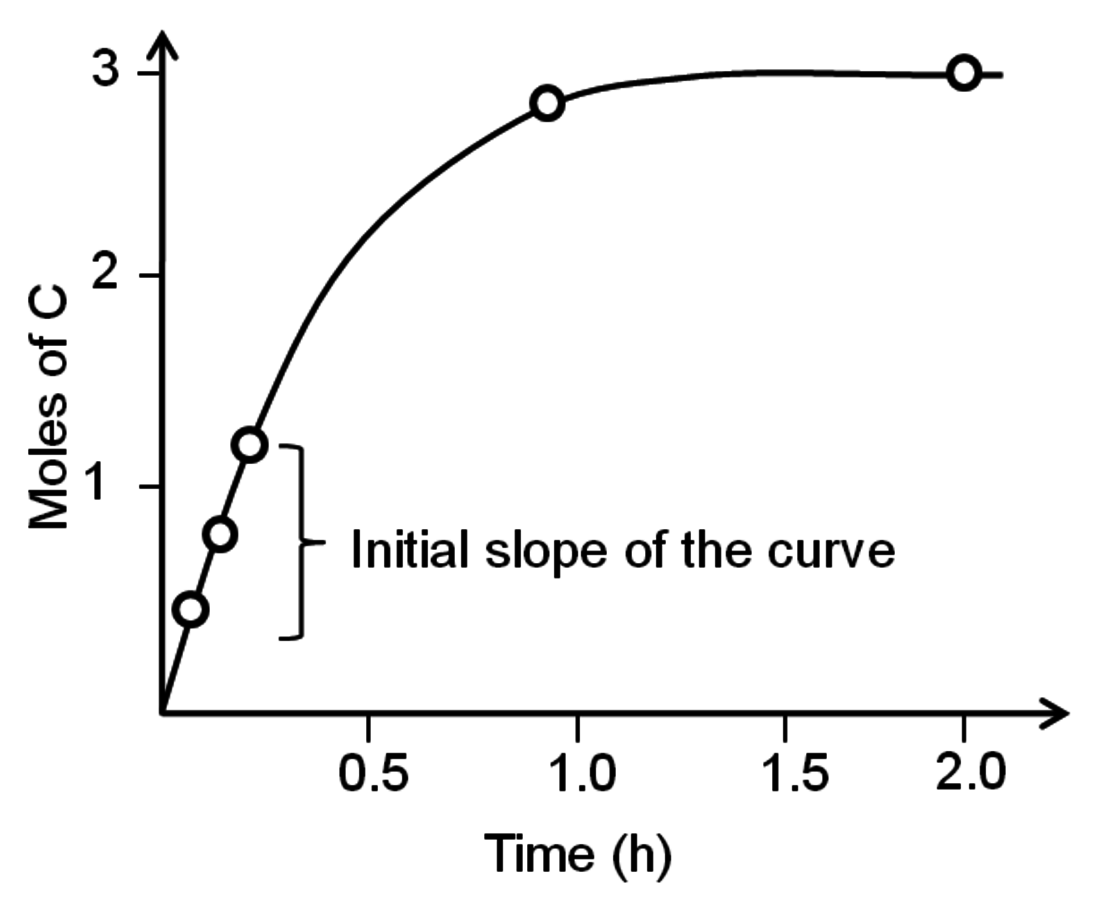

Fig. 9.1: Evolution of product with time in a batch reactor for the reaction of
Since catalysis is a kinetic phenomenon, it is proper to report a rate instead of a yield, preferably normalized by some property of the catalyst relevant to the reaction. If possible, a rate should be reported as a turnover frequency, or TOF, which requires some measure of the active sites on the catalyst. The catalytic conversion of biorenewable molecules generally involves metal catalysts for reactions such as hydrogenation, dehydrogenation, oxidation, decarboxylation, decarbonylation and reforming as well as acid/base catalysts for dehydration, (trans)esterification, hydrolysis and condensation reactions. Thus, characterization of the catalysts used in the conversion of biorenewable molecules should include a measure of the metal dispersion determined either by chemisorption of probe molecules such as CO or
 , or by direct imaging of the particles by electron microscopy. For counting the number of acid and base sites on catalysts, standard probes such as ammonia and carbon dioxide, respectively, are often used. Some catalysts cannot be appropriately pretreated for gas adsorption studies, so adsorption of species from solution can be performed instead. For example, a recent study by Xi and Davis on the transesterification of tributyrin with methanol over basic hydrotalcite catalysts utilized the adsorption of phenol onto the hydrotalcites in cyclohexane solvent to count the number of base sites on the catalysts [8]. A turnover rate for transesterification was based on the active site density evaluated by the amount of phenol adsorbed on the samples. Expressing reaction rates as turnover frequencies enables a straightforward comparison of catalyst activity among different samples and different laboratories.
9.3 Kinetics of Chemical Reactions
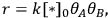
The rate of reaction is often a strong function of reactant concentrations and, although the order of reaction with respect to various reagents is often positive, it can also be negative because of strong adsorption on the catalyst surface. This can be easily understood from the basic Langmuir-Hinshelwood expression for the rate of reaction of A and B to irreversibly form products in the presence of a solid catalyst. The rate can be written as:
|
9.5 |
where
 and
and
 represent the coverage of species A and species B on the catalyst surface, k is the surface reaction rate constant, and
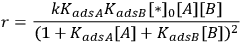
 is the density of active sites on the surface. If the reactants A and B are equilibrated with the surface according to the adsorption equilibrium constants KadsA and KadsB, and the surface reaction is one way, or irreversible, then the above rate expression can be expressed as:
|
9.6 |
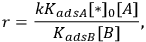
Depending on the magnitude of the equilibrium constants, the order of reaction in either A or B can vary between +1 and -1. For the specific case of KadsB[B]>>KadsA and KadsB>>1, the rate reduces to:
|
9.7 |
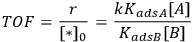
which illustrates how the reaction orders in A and in B can be +1 and -1, respectively. The rate should be expressed as a turnover frequency if possible; so if
 can be measured from chemisorption, then the TOF can be calculated:
|
9.8 |
The rates of some catalytic reactions can also be inhibited by the products; for example, the rate of alcohol oxidation is sometimes claimed to be inhibited by adsorption of the acid products on the catalyst. This phenomenon complicates the measurement of initial rates since the product concentration changes significantly at the beginning of a reaction. For the reaction profile in Figure 9.1, which describes the evolution of product C from the reaction of A and B, product inhibition would complicate the calculation of the rate from the initial slope of the reaction profile. In cases involving product inhibition, initial rates should be evaluated with various levels of C in the reactor to quantify the influence of the product on the conversion process.
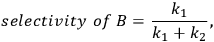
When more than one reaction occurs, the selectivity of the desired chemical transformation should be reported together with the rate. The overall selectivity of a reaction sequence is often defined as the ratio of the total amount of desired species formed to the total amount of all products formed. However, the amount of product can be based on a variety of factors, such as the number of moles of the products, the number of moles of carbon in the products, the mass of the products, etc. Therefore, it is imperative for researchers to report the exact definition of selectivity used in their work. A term that is sometimes referred to as the instantaneous selectivity is defined as the ratio of the rate of desired product formation over the sum of the rates of formation of all of the products. The difference between the overall selectivity and instantaneous selectivity is illustrated by a simple example involving parallel and sequential reactions. The reaction of A to form either desired product B or undesired product C via two parallel, irreversible first order reactions (
 and
and
 ) with rate constants k1 and k2, respectively, has an overall selectivity to product B that is identical to the instantaneous selectivity:
|
9.9 |
because the selectivity in this case does not depend on conversion. A very different result is found when reactions are sequential. Consider the irreversible first order reaction of A to form B which subsequently reacts to form C (
 C). At a very early time in the reaction (or low conversion of A), the rate of formation of B is far greater than the rate of formation of C so both the overall selectivity to B and the instantaneous selectivity to B are very high. However, at a late stage of the reaction (high conversion A), B is actually being consumed (negative rate of formation) and there is little B left in the reactor compared to C. Clearly, the selectivity to B and C, regardless of the definition of selectivity, changes throughout the progress of the reaction. This example illustrates the importance of reporting product selectivities at identical levels of conversion when trying to compare the effectiveness of particular catalysts or operating conditions.
The conversion of biorenewable molecules usually involves more than one reaction, so selectivity needs to be appropriately reported in all published papers. A convenient feature of complex reaction networks is that they consist of assemblies of either parallel or series reactions. Consider, for example, the oxidation of the sugar-derived 5-hydroxymethylfurfural (HMF) to 2,5-furandicarboxylic acid (FDCA) according to the network in Figure 9.2.
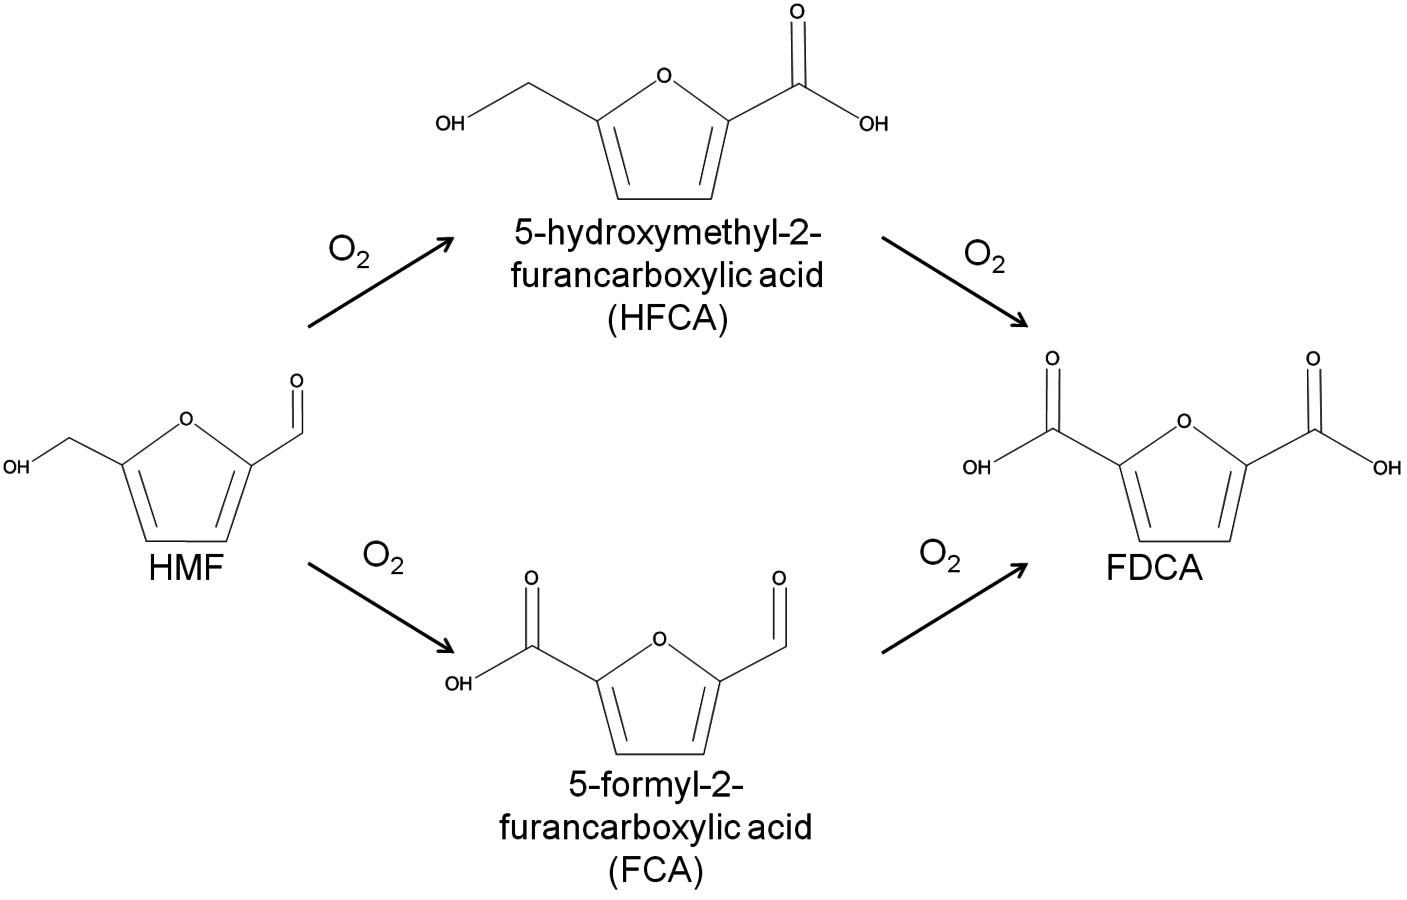
Fig. 9.2: Schematic of the reaction network for the catalytic oxidation of 5-hydroxymethylfurfural (HMF) to 2,5-furandicarboxylic acid (FDCA) in aqueous solution
The reactant HMF has two side chains where oxidation can take place. The initial conversion of HMF occurs in the two parallel reactions that oxidize either the aldehyde side chain to form 5-hydroxymethyl-2-furancarboxylic acid (HFCA) or the alcohol side chain to form 5-formyl-2-furancarboxylic acid (FCA). The sequential oxidation of both HFCA and FCA produces the final product FDCA. Figure 9.3 illustrates the reaction profile of HMF oxidation with
 in basic aqueous solution over a carbon-supported Pt catalyst. The parallel and sequential nature of the network is illustrated by the early formation of HFCA and FCA followed by their conversion to the final product FDCA. Over Au catalysts, the initial reaction of HMF to HFCA was found to be very rapid, whereas the subsequent conversion of HFCA to FDCA was quite slow [9]. This reaction network shows the critical importance of comparing selectivity at identical levels of conversion. If it all possible, reporting the entire reaction profile is preferable.
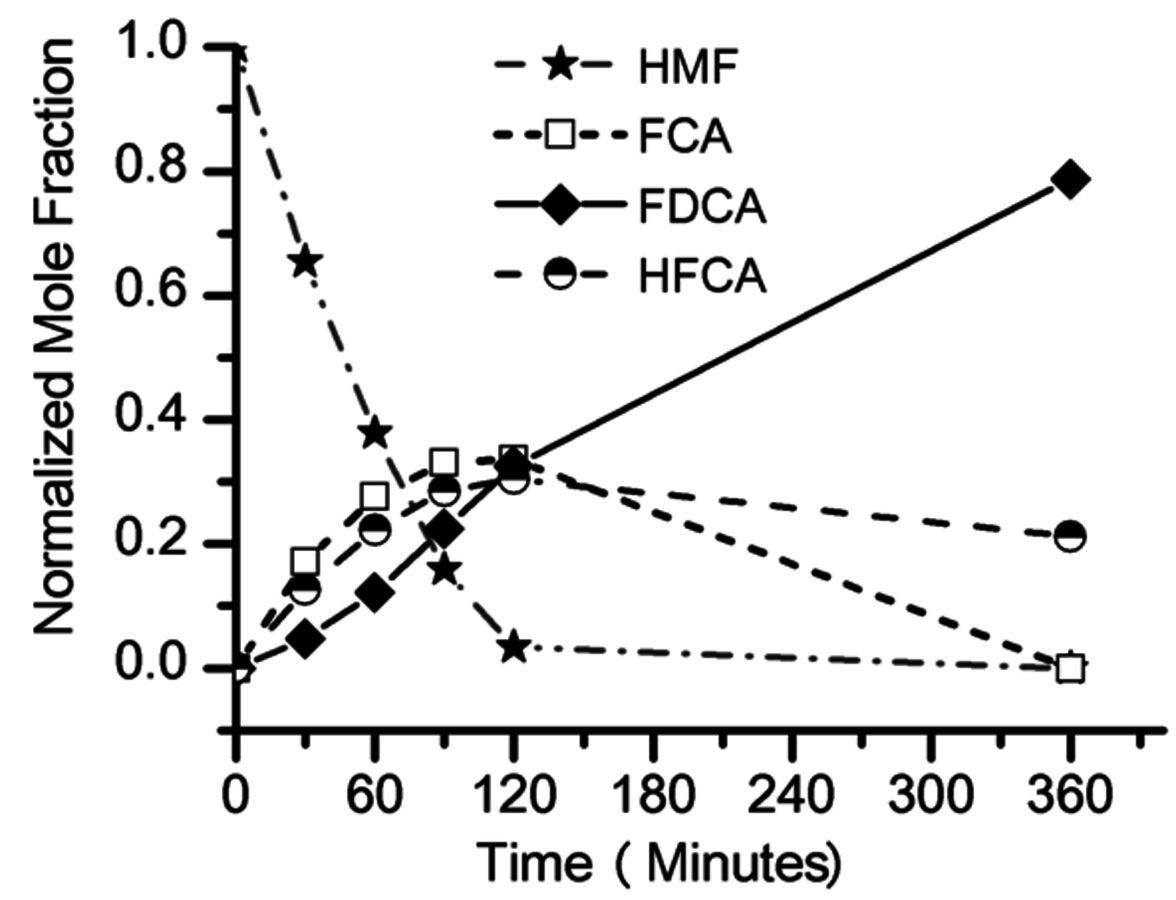
Fig. 9.3: Reaction profile of HMF oxidation in 0.15 M HMF, 0.3 M NaOH aqueous solution over a supported Pt catalyst at 295 K and 690 kPa O2, adapted from Davis [9]
When reporting reaction rates and selectivities, it is very useful to also report the overall carbon balance in the system. Many of the reactions of interest in the conversion of biomass create tars or light gases that are difficult to quantify. Therefore, the overall carbon balance of the system provides some indication of how important unreported side reactions are in the system. Researchers in this field do not expect the balance to close to 100% because of the difficulty of identifying unknown compounds derived from complex biomass feeds and the formation of carbonaceous residues. Thus, attempts to quantify and report the carbon balance should be made so that others can better understand the overall catalytic process being investigated.
9.4 Deactivation of Catalysts
In a perfect world, catalysts would function forever and never need to be replaced. In reality, however, catalysts lose their activity and/or selectivity over time and eventually become ineffective. Thus, it is just as important to evaluate the stability of catalysts as it is to evaluate their activity and selectivity. The definition of stability depends on one’s perspective. Industrial researchers often explore the stability of catalysts over the time frame of months, whereas academic researchers shorten that period to hours or perhaps days.
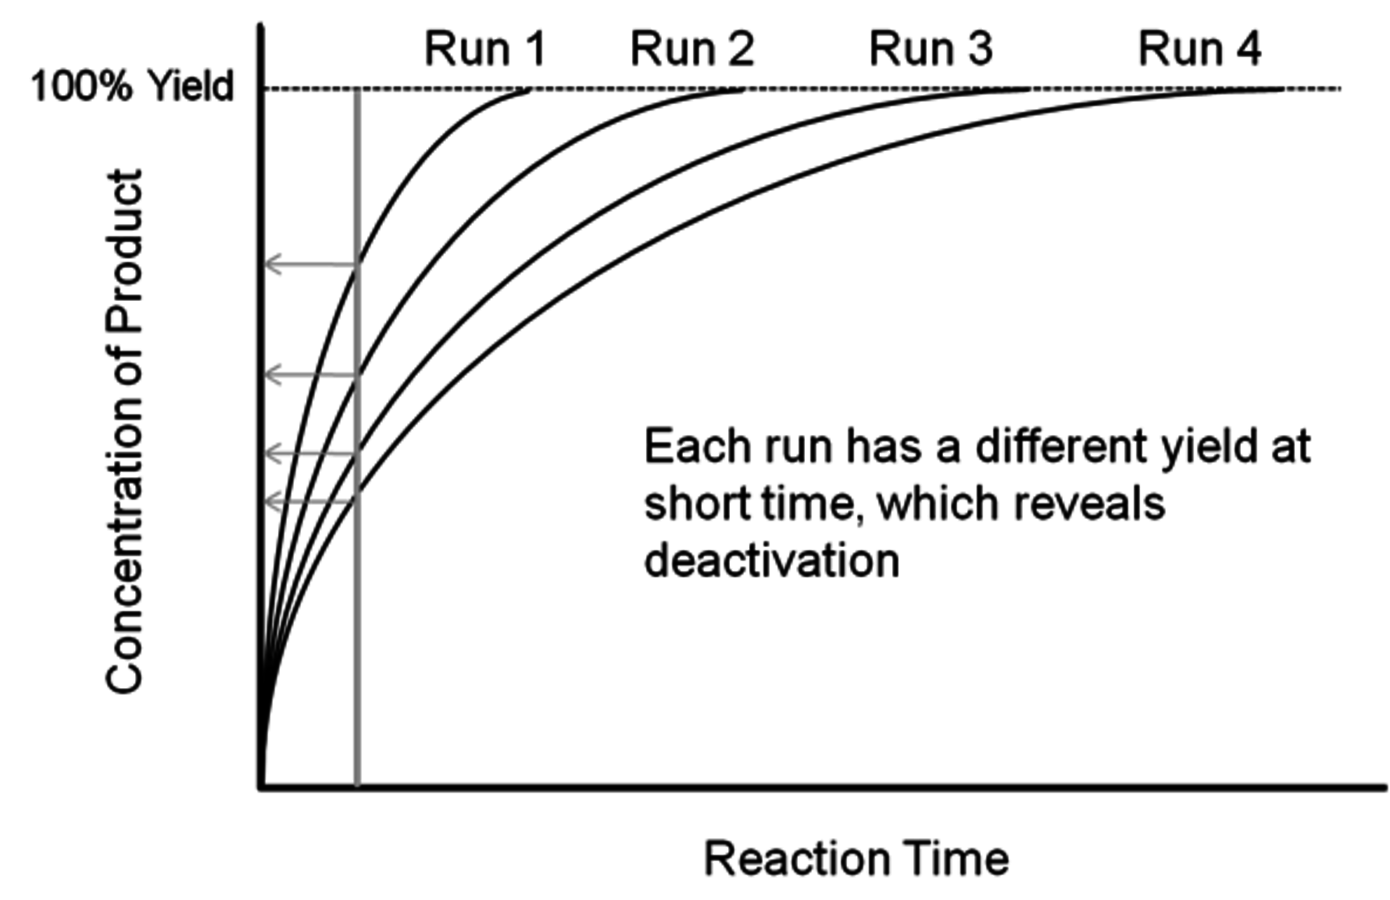
Fig. 9.4: Schematic of the reaction profiles associated with the classic recycle test. After each run, the catalyst is recovered and reused in the subsequent run.
Since many studies with biomass-relevant feeds are performed with batch reactors, a common stability probe is known as the recycle test in which catalyst performance is examined after repeated recovery and reuse cycles. Figure 9.4 shows four reaction profiles corresponding to four reaction runs that involve recovery and reuse of the exact same catalyst in each subsequent run. The product is formed in very high yield in all four runs. Thus, if the products are only sampled after long reaction times, very high yield will be reported after each run and the incorrect conclusion that the catalyst is stable will be presented. However, if the reaction products are sampled at a shorter time (as shown in Figure 9.4) then each run will have less product formed than the previous run, demonstrating the deactivation of the catalyst. This example illustrates the importance of reporting reaction rates during the recycle test instead of simply reporting product yields.
Deactivation is caused by a variety of phenomena, including migration of metal atoms during reaction, adsorption of poisons onto the active sites, and leaching of active species into the reaction medium. Although nanometer-size metal particles are often used as catalysts, they can agglomerate or sinter on the support during reactions at elevated temperature or when the support is transformed in the reaction medium. Moreover, the surface composition of bimetallic nanoparticles can be influenced by the nature of the reaction medium, which can result in a severe restructuring of a bimetallic catalyst in the reactor compared to its structure immediately after preparation. Adsorption of poisons onto a catalyst is particularly problematic when processing impure feed streams such as those derived from raw biomass. For example, trace organic acids can poison catalytic base sites, which is a special concern in the base-catalyzed transesterification of triglycerides with a short chain alcohol to produce biodiesel. The free fatty acid content of biodiesel feedstocks needs to be very low to prevent neutralization of the base catalyst. Since carbon dioxide is also a poison for many solid base catalysts, air-free handling of solid-base catalyzed reactions is required. The influences of base impurities on the performance of acid catalysts are analogous to those mentioned for acid impurities on base catalysts. Some components of biomass contain sulfur, which can severely poison transition metal catalysts when it is present in a reduced form. Although the acid, base, and inorganic components of biomass are potential causes of catalyst deactivation, the carbon backbone of the biomass itself can also be converted into strongly adsorbed carbonaceous deposits that can block active sites on the catalyst.
Ketchie et al. explored the stability of ruthenium metal particles on various supports in liquid water at 473 K at high pH [10]. In that study, ruthenium was supported on γ-alumina, carbon, titania, and silica and reduced in gaseous
 at 473 K to generate highly-dispersed supported Ru particles of 1 to 2 nm in average diameter as determined by X-ray absorption spectroscopy and chemisorption of hydrogen. For the particles supported on γ-alumina and silica, the Ru particle size increased substantially after subsequent reduction by
 in liquid water at 473 K, indicating a critical role of water on the restructuring of the catalyst. The silica catalyst actually dissolved in 0.4 M NaOH solution at 473 K and the Ru particle size on alumina continued to grow in the basic solution. The X-ray diffraction patterns of the alumina-supported catalyst after the various aqueous treatments revealed a transformation of the support into lower surface area, crystalline, bohemite. Interestingly, the Ru particles on carbon and titania were little affected by the aqueous treatments at 473 K, which suggests that these supports are good candidates for further study in the conversion of biomass feeds under aqueous conditions. Clearly, the use of silica and transitional alumina supports should be avoided if at all possible in studies involving liquid water at elevated temperature since the poor stability of these supports can allow the metal particle size to increase.
Maris et al. examined the influence of reaction conditions on the structure of bimetallic Pt-Ru and Au-Ru catalysts used for the hydrogenolysis of glycerol to ethylene glycol, propylene glycol, and (sometimes) lactic acid [11]. The bimetallic catalysts were prepared by selective reduction of HAuCl4 and
 onto a monometallic carbon-supported Ru catalyst. Catalysts were analyzed by electron microscopy, chemisorption of hydrogen, and X-ray absorption spectroscopy to evaluate particle size and distribution of the metals. Single particle elemental analysis in the electron microscope confirmed the selective reduction of Pt by Ru since both elements were present in individual metal particles. However, single particle analysis revealed the presence of monometallic Au and Ru particles as well as bimetallic Au-Ru particles after the attempted reduction of Au selectively onto Ru. Evidently, the synthesis of Pt-Ru generated a more uniformly bimetallic sample than the synthesis of Au-Ru. To confirm the presence of Au on the Ru, ethane hydrogenolysis at 473 K was performed over the parent Ru/C and the bimetallic Au-Ru/C sample. The presence of Au suppressed the turnover frequency on Ru by a factor of 4–5. Interestingly, the turnover frequency on the Pt-Ru sample was similar to that on Ru, even though a monometallic Pt/C catalyst was inactive under identical conditions. Analysis of the X-ray spectra associated with the Pt, Au and Ru components of the catalysts after reduction of the catalysts by gaseous H2 at 473 K confirmed that first-shell Pt-Ru and Au-Ru interactions were present in the fresh materials, as expected. These catalysts were then used for glycerol hydrogenolysis with 40 bar
 in liquid water at 473 K at neutral and high pH. Both of the bimetallic samples catalyzed the glycerol hydrogenolysis reaction with an activity and selectivity similar to that of the monometallic Ru catalyst. A post-mortem analysis of the Au-Ru sample by electron microscopy and X-ray absorption spectroscopy revealed a severe restructuring of the catalyst after the harsh conditions of the glycerol hydrogenolysis reaction. The Au-Ru interaction, which was observed in the X-ray analysis of the fresh catalyst, was completely absent in the used catalyst, and electron microscopy revealed new large gold particles on the support after the reaction. Since X-ray absorption spectroscopy of the Pt-Ru catalyst was nearly identical to the fresh catalyst, the bimetallic Pt-Ru particles were claimed to be much more stable to the aqueous phase reaction conditions than the Au-Ru particles.
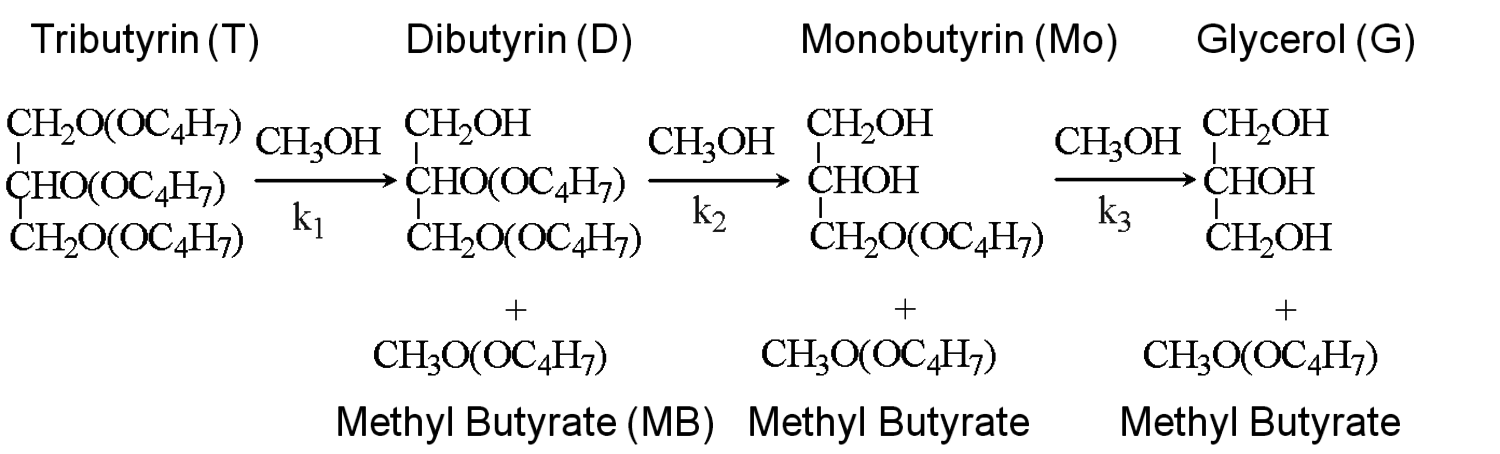
Fig. 9.5: Sequential transesterification reactions during the conversion of tributyrin to methyl butyrate and glycerol over solid base catalysts [8,12]
The transesterification of triglycerides with methanol provides an excellent example to illustrate the poisoning influence of acids on base catalysts. Xi and Davis studied the transesterification of a model triglyceride known as tributyrin with methanol over a hydrotalcite base catalyst to produce methyl butyrate (a short chain biodiesel analogue) in the sequential reaction depicted in Figure 9.5 [8,12]. Hydrotalcite is a magnesium-aluminum hydroxycarbonate with brucite-type layers of magnesium hydroxide that have some of the magnesium cations replaced with aluminum cations, thus generating a positive charge on the layers. Interlayer anions such as carbonates are therefore needed to maintain electroneutrality of the sample. The upper left portion of Figure 9.6 represents the layered structure typical of hydrotalcite together with carbonate anions and water molecules in the interlayer region. The carbonate form of hydrotalcite, however, is a very weak base and is therefore not effective in catalysis. Conversion of the charge-balancing carbonate anions to hydroxide anions creates a powerful solid Brønsted base that can be utilized in catalytic reactions. Simple ion-exchange of hydroxide for carbonate does not occur because of the high affinity of hydrotalcite for carbonate anions. Therefore, hydrotalcite was decomposed to a mixed oxide of magnesia and alumina followed by rehydration with
 -free water to regenerate the hydrotalcite with hydroxide as the charge balancing anion instead of carbonate, as depicted in Figure 9.6.
This procedure was used to generate a variety of hydrotalcite base catalysts in the work of Xi and Davis [8,12]. After ensuring that
 -free handling procedures were sufficient, they observed that the water content of the newly-prepared hydrotalcite in the OH- form was a critical parameter that influenced the transesterification activity of the catalyst. As the OH- form of hydrotalcite was progressively dried under increasingly rigorous conditions while maintaining the layered structure, the activity of the catalyst was found to decline.
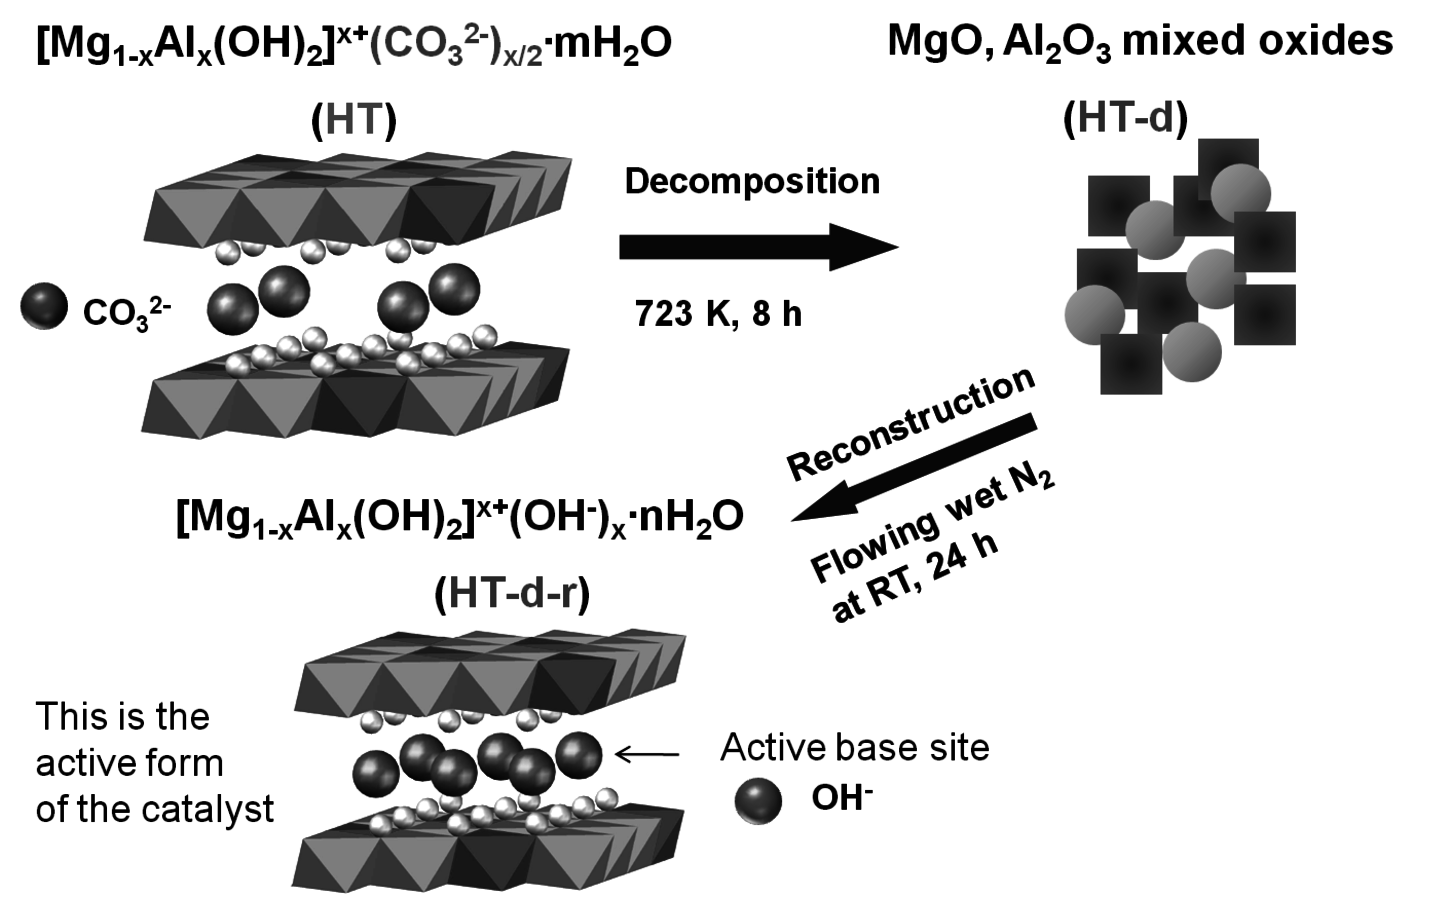
Fig. 9.6: Synthesis of hydrotalcite base catalyst by sequential decomposition and rehydration to the OH- form [courtesy of Y. Xi]
Thus, catalysts that contained the highest loadings of water were the most active. Unfortunately, these active catalysts also deactivated very quickly. Characterization of the used catalysts by X-ray diffraction and FT-IR spectroscopy revealed a significant expansion of the interlayer spacing of the used material compared to a fresh catalyst and the presence of carboxylate species on the used catalyst. Those results pointed to the idea that water or hydroxide facilitated the hydrolysis of tributyrin (or its reaction products) to butyric acid, which would subsequently neutralize the base sites of the hydrotalcite and deactivate the catalyst. Control experiments with butyric acid were consistent with the characterization results. In this case, water accelerated both the desirable transesterification of tributyrin with methanol as well as the undesirable side reaction of hydrolysis to carboxylic acid. The intercalation of butyric acid into the hydrotalcite layers and reaction with the base sites, as depicted in Figure 9.7, is consistent with the observed deactivation of the catalyst and the characterization results by diffraction and spectroscopy. In this particular example, the deactivating species was generated by a side reaction with the active phase of the catalyst.
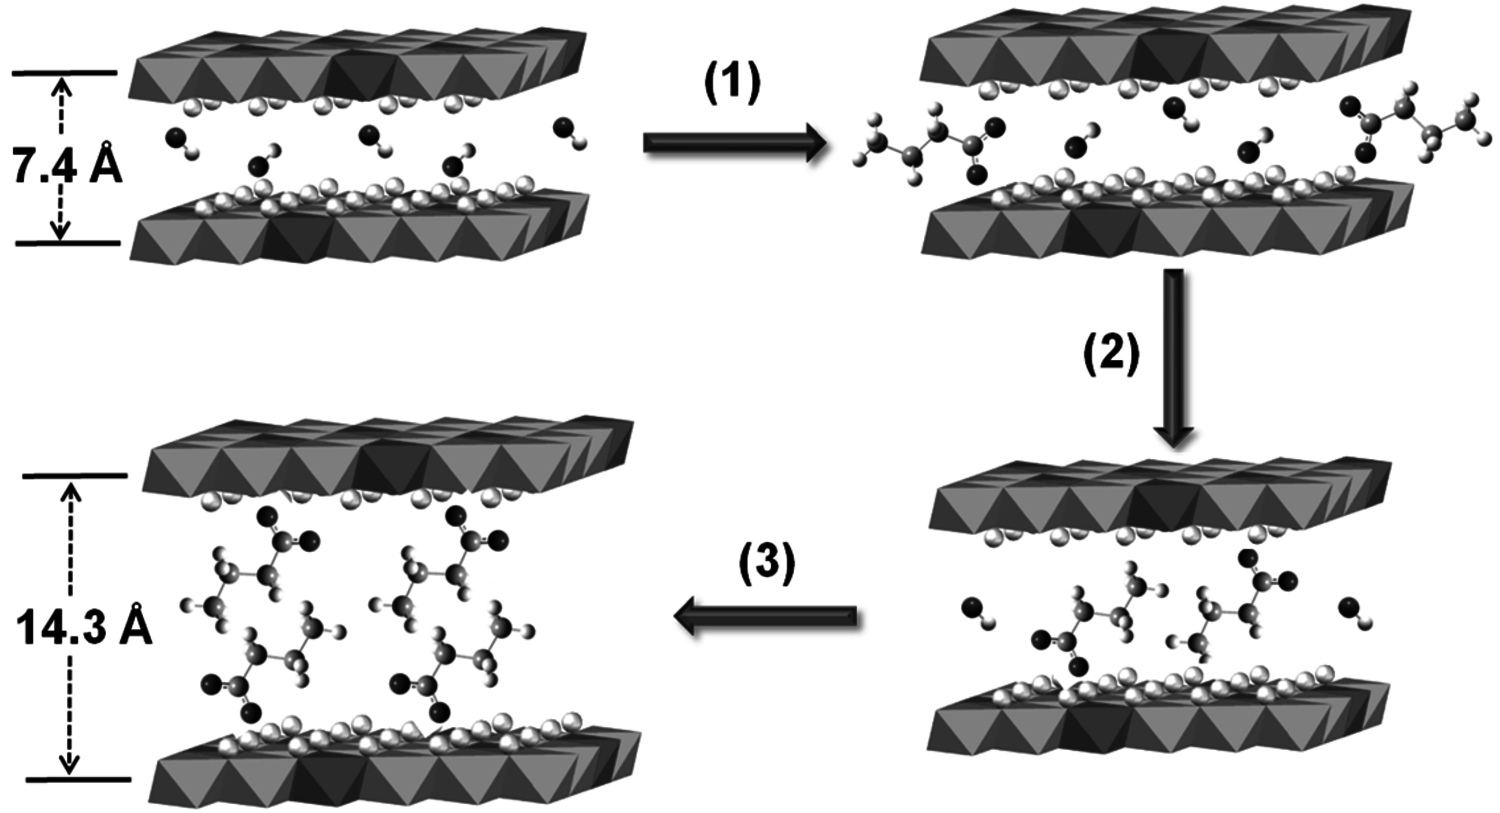
Fig. 9.7: Expansion of hydrotalcite layers during catalyst deactivation by reaction with butyric acid [courtesy of Y. Xi]
Leaching of the active phase from a solid catalyst will impact its long term viability as well as the purity of the product stream. Therefore, some evaluation of catalyst leaching should be performed when solid catalysts are utilized in liquid reaction media. For example, the hydrotalcite catalyst described previously was removed by filtering the hot solution after about 60% conversion of the tributyrin was accomplished [12]. The partially reacted mixture was then returned to the reactor to see if further conversion of tributyrin was accomplished. Since the reaction was completely halted after removal of the catalyst, Xi and Davis concluded that the reaction was catalyzed by the hydrotalcite and not any trace components that might have leached from the solid into solution [12]. The opposite conclusion was reported in a paper by those authors for the same reaction catalyzed by layered yttrium hydroxide containing intercalated ethylene glycol [13]. In that study, the catalyst was removed from the reactor after about 40% conversion of tributyrin, but the reaction mixture continued to react in the absence of any catalyst. Evidently, a significant fraction, if not all, of the observed activity resulted from components that leached from the solid into the reactant mixture.
The hot filtration test described above is only one test often used by researchers to explore catalyst leaching. Many researchers also submit both the catalyst and reaction medium to analysis for various elements responsible for the active phase. When supported metal catalysts are used, analysis of the trace metal content in solution as well as the metal loading on the catalyst before and after reaction can be used to evaluate movement of active metal from the solid to the solution. Another test for leaching involves recovery and reuse of the catalyst in subsequent runs. Although deactivation of the catalyst may or may not be caused by leaching, a constant activity with multiple uses is often claimed to be good evidence that the solid catalyst is effective for reaction and that leaching is not important.
Phan et al. recently published a comprehensive review of Pd-catalyzed Mizo- roki-Heck and Suzuki-Miyaura coupling reactions with a critical assessment of whether or not leached Pd species in solution are the active sites [14]. A complication with these coupling reactions is that very low levels of Pd can facilitate the transformations, so a major issue in the field involves the idea that solid-supported metal particles or metal complexes can serve as reservoirs that may release molecular Pd species into solution as the active species. Elemental analyses of the reactant mixtures are generally inconclusive since extremely low levels of Pd, perhaps as low as parts per billion, can be active for the reaction. Extensive research has confirmed that Pd metal does indeed leach into solution during the reactions but then re-deposits back onto the supports upon completion. This phenomenon of leaching and re-deposition during the course of a reaction is precisely why the hot filtration test is best performed in the middle of the reaction when all of the reagents and products are still present in the medium. For the case of the Pd-catalyzed coupling reactions, the rapid deposition of molecular Pd species onto the support during the filtration process could also provide misleading results. Nevertheless, correlation of the coupling rate with the amount of soluble Pd suggests that molecular Pd species are important in the reaction. For cases such as this one in which there are indications that soluble species are critical for reactivity, additional tests need to be performed. Phan et al. describe a poisoning test and a three-phase test to probe the activity of soluble species [14]. In the poisoning test, a solid material that binds the active species in solution is added to the reaction medium—if the reaction is halted by the presence of the solid poison, then the reaction is probably catalyzed exclusively by species in the liquid phase. The three-phase test is a great one for a reaction that involves two reagents and a catalyst. It involves the anchoring of one of the reagents to a solid support and running the reaction with a solid catalyst in the presence of the second liquid phase reagent. Analysis of the supported reagent is used to verify if any reaction occurred in the presence of the catalyst. If there is any conversion of the supported reagent, then the solution phase must have been involved in the catalytic transformation since solid-solid interactions are not favored. A negative test is inconclusive, however, if the anchored reagent is the one that causes leaching of the active phase.
The catalytic transformations of biomass are often performed in the presence of a liquid phase, so evaluation of the solution phase activity should always be performed. Even if the catalyst under investigation does not leach into solution, an understanding of its deactivation profile is important to the field. Although characterization of catalysts under working conditions is best, post-mortem characterization studies can still yield useful insights into the potential causes of catalyst deactivation.
9.5 Reactors Used to Evaluate Catalysts
A common reactor used to study catalytic reactions in a solvent is a stirred vessel or a stirred autoclave reactor. Autoclave reactors for research purposes can be readily purchased at a very modest cost. This type of reactor is termed a batch or semibatch reactor, depending on whether or not reagents are continually added or removed. For example, hydrogenation of a biorenewable molecule that takes place in an autoclave that has been pressurized, and then sealed, is said to occur in a batch mode. However, if the autoclave is connected to a continuous source of hydrogen to maintain a constant pressure in the reactor, then the reactor is operated in a semi-batch mode. In either case, the biorenewable substrate is consumed in the reactor and the reaction rate is evaluated by monitoring the concentrations of the reactants and products with time in the reactor. Batch or semibatch reactors are simple to operate and the solid catalyst can be recovered by simple filtration. Batch reactors are used commercially to produce small-volume, high-value chemicals where the economics of a massive scale are not needed to ensure profitability. Moreover, monitoring of batch processes for quality assurance is straightforward since products are produced in well-separated lots that can be individually-analyzed and tracked. Thus, batch processes are very common in the production of specialty chemicals and pharmaceuticals.
In contrast to batch reactors, flow reactors offer the opportunity to convert reagents in a continuous manner, thus allowing the reacting system to theoretically achieve a stationary state, or steady state, operating condition in which reactants are continually fed to the reactor and products are continually removed. In its simplest form, a catalytic flow reactor consists of a tube packed with catalyst pellets. This configuration, termed a packed bed or fixed bed reactor, requires the catalyst pellets to be immobilized in the tube by mesh screens, glass beads, or some other sort of mechanical device. Catalyst particles can also be fixed to the walls of a reactor. Flow reactors can process very large volumes of material in an efficient manner, which is appropriate for the production of commodity chemicals and the refining of fuels. Moreover, since flow reactors can reach a steady state, kinetic studies that involve changing parameters such as reactant concentration and reaction temperature can be easily performed without having to reload the reactor and restart the reaction. Deactivation in a flow reactor is evaluated by simply monitoring the decline in product concentration exiting the reactor with time, while keeping all other process variables constant. The mathematical treatment of chemical transformations in flow reactors is beyond the scope of this chapter, so the reader is referred to the many textbooks on reaction engineering that were cited in the Introduction for additional information.
In the conversion of biorenewable molecules, the reacting system will often include three phases: a solid catalyst, reagents dissolved in a liquid medium, and a mixture of products in the liquid phase as well as the gas phase. The proper operation and analysis of three-phase systems is quite complex and researchers should strive to simplify their particular configuration if at all possible. One simple example of the possible complexity of three-phase operations involves the choice of whether to flow the liquid reagents in a downflow mode or an upflow mode. Although this looks like a trivial choice at first glance, the realization that gaseous products could be generated as the liquid flows over the catalyst particles in the reactor complicates the flow pattern. In the downflow configuration, gas bubbles that form in the reactor could possibly travel upward, countercurrent to the fluid, because of their buoyancy. Thus, the size of the gas bubbles formed and the velocity of the fluid flowing down through the reactor will determine how the gas exits the reactor. In the upflow configuration, the fluid velocity is in the same direction as the buoyant forces on the gas bubbles, so that both the liquid and the gas will exit the top of the column. Although there is no “correct” way to operate, researchers need to realize that simple physical phenomena can affect the observed behavior in a reactor.
9.6 Mass and Heat Transfer Artifacts
Since multiple phases of matter can exist in a catalytic reactor, the transport of reagents and products between those phases can limit the rate of chemical reaction of those species. Likewise, the rate of transport of heat to a catalyst (for an endothermic reaction) or away from a catalyst (for an exothermic reaction) can affect the observed rate of a reaction. To properly evaluate the intrinsic reaction rate of a chemical reaction occurring in the presence of a solid catalyst, which is certainly the desired goal when comparing a set of catalysts or designing a new process, some estimation of the mass and heat transfer artifacts in the observed rate should be performed. If the rate of mass (or heat) transfer through the reactor limits the observed rate, then the experimental parameters must be adjusted to either lower the reaction rate (i.e., lower reaction temperature, different reactant concentrations) and/or increase the rate of mass (or heat) transfer (i.e., increase agitation rate, increase flow rate, decrease catalyst particle size). The following sections describe how mass or heat transfer limitations can affect observed reaction rates.
9.6.1 Gas-Liquid Transport
For reactions in which a gaseous reagent is consumed in a liquid solvent in the presence of a solid catalyst, there are several regions in which mass transfer can affect the rate of conversion: the dissolution of gas into the liquid, the transport of dissolved gas through the stagnant boundary layer surrounding a catalyst particle, and the diffusion of dissolved gas through the pores of a catalyst particle. The importance of gas-liquid mass transfer will be discussed first.
Supported gold particles are extremely active catalysts for the oxidation of substrates such as glycerol and hydroxymethylfurfural (HMF) in liquid water at high pH [9,15]. Very high observed turnover frequencies that exceed 1 s-1 for the oxidation reaction on supported Au suggest that the transport of
 could limit the reaction rate. Therefore, a check on the mass transfer characteristics within the reactor is warranted.
The oxidation of glycerol and HMF over supported gold catalysts was accomplished in a semi-batch reactor in which a slurry of gold catalyst and reactant in aqueous solution at high pH were stirred under a constant pressure of

[9,16]. Transport of oxygen across the small interface between the headspace in the reactor and the agitated solvent could possibly limit the observed reaction rate. Therefore, a recommended practice is to evaluate the maximum rate of oxygen transfer under exactly the same conditions of liquid volume, gas pressure and agitation in the system by performing a separate reaction in which oxygen transfer is known to be rate-limiting. A comparison of the maximum flux of oxygen to that observed under catalytic conditions will demonstrate whether or not mass transfer from the gas to the liquid is limiting the observed rate. An effective way to determine the flux of oxygen in a chemical reactor is to utilize a reaction known to biochemical engineers for the evaluation of the volumetric mass transfer coefficient during aerobic fermentation [15]. Specifically, the oxidation of sulfite anions to sulfate anions by
 can be used to measure the maximum flux of oxygen into the liquid phase. The sodium sulfite oxidation experiments confirmed that indeed the transfer rate of oxygen could sometimes limit the oxidation rate over Au catalysts, so the amount of Au in the reactor was decreased to appropriate levels prior to reporting rates.
9.6.2 Gas-Solid and Liquid-Solid Transport
For reactions catalyzed by solid particles, transport of reagents through the stagnant boundary layer surrounding the particles (Region 1 in Figure 9.8) and transport within the pore network (Region 2 in Figure 9.8) can potentially limit the observed reaction rate. Thus, researchers need to ensure that artifacts in kinetic studies resulting from transport limitations involving the catalyst particles are minimized.
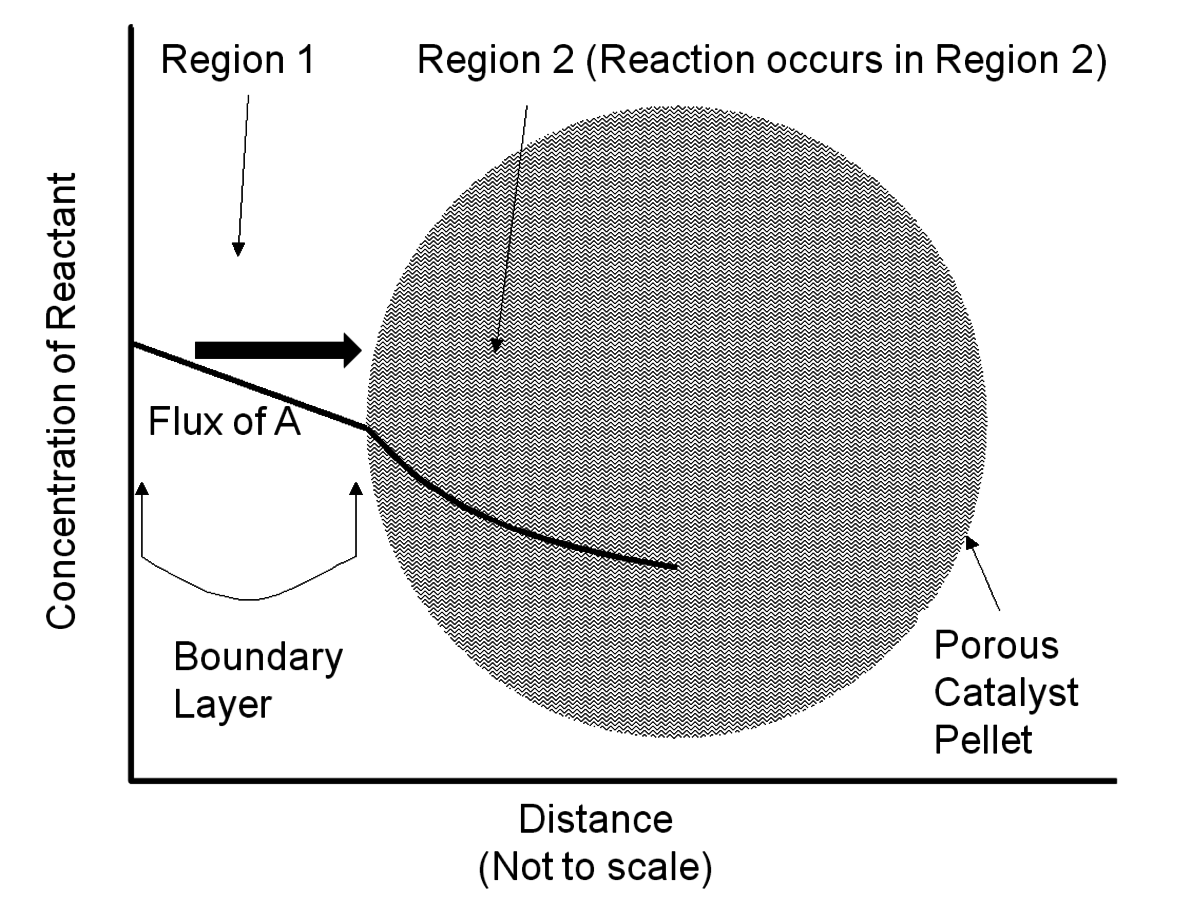
Fig. 9.8: Concentration profile of a reactant A in the vicinity of a porous solid catalyst particle. Region 1 depicts the stagnant boundary layer surrounding the particle and Region 2 depicts the porous interior of a catalyst particle where active sites are located. Adapted from Davis [7]
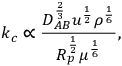
A simple mathematical analysis (not presented here) illustrates that the flux of a reactant to a catalyst particle is directly proportional to the concentration difference between the bulk fluid phase surrounding a particle and the external surface of the catalyst, as represented in Region 1 of Figure 9.8, with a proportionality constant assigned as the mass transfer coefficient kc. The linearity of the concentration profile in this region results from the assumption that no chemical reactions occur in the boundary layer. According to this analysis, mass transfer characteristics of the system can be improved by simply adjusting system variables that increase the mass transfer coefficient. The following relationship between the mass transfer coefficient associated with flow around spherical particles and a variety of process variables can be derived from engineering correlations:
|
9.10 |
where DAB, u, ρ, Rp and μ represent the diffusivity of A in medium B, the linear fluid velocity, the fluid density, the radius of the catalyst particle, and the viscosity of the fluid, respectively. Properties such as diffusivity, fluid density, and fluid viscosity are very difficult to change in a reacting system and are not usually considered as adjustable process variables. In contrast, increasing the linear fluid velocity (by stirring faster or flowing faster) and decreasing catalyst particle size are often used to increase the mass transfer coefficient of a catalytic system. It should be emphasized that pressure drop through a packed bed of particles is often the limiting process variable since utilizing smaller catalyst particles and increasing the flow of reagents can potentially cause an unacceptably high pressure drop in a flow reactor.
Assuming the mass transfer characteristics surrounding a catalyst particle are acceptable, reagents and products still need to navigate the internal pore network of the catalyst as depicted in Region 2 of Figure 9.8. The concentration profile within the particle is non-linear because the reagent is consumed as it proceeds into the catalyst interior. The analysis of mass transfer characteristics in porous catalysts is complicated by the fact that both reaction and diffusion occur simultaneously.
Figure 9.9 summarizes how the diffusivity of gaseous molecules is affected by the pore size of a catalyst particle. Most importantly, diffusion in very large pores is controlled by molecule–molecule collisions and is termed molecular diffusion in Figure 9.9. However, as the pore size decreases to the same size as the mean free path of the gaseous molecules, collisions between the gas and the pore walls become increasingly important. This type of diffusion, known as Knudsen diffusion, is obviously a strong function of the size of the pore, as illustrated in Figure 9.9. Single file diffusion involves pores that are too narrow to allow molecules to pass each other, which can be important in biomass-related systems involving very large molecules. It should be noted that Figure 9.9 summarizes the diffusivity of gaseous molecules in porous systems. The molecular diffusivity of most compounds in the liquid phase is often in the range of 10-5 cm2 s-1, which is significantly less than the molecular diffusivity and the Knudsen diffusivity for gas-solid systems as represented in Figure 9.9. The lower diffusivity of molecules in a liquid medium results from the frequent collisions with solvent molecules in a condensed phase. For liquids, molecule-fluid collisions always dominate over molecule-pore collisions until pores become so small that only single file diffusion can occur.
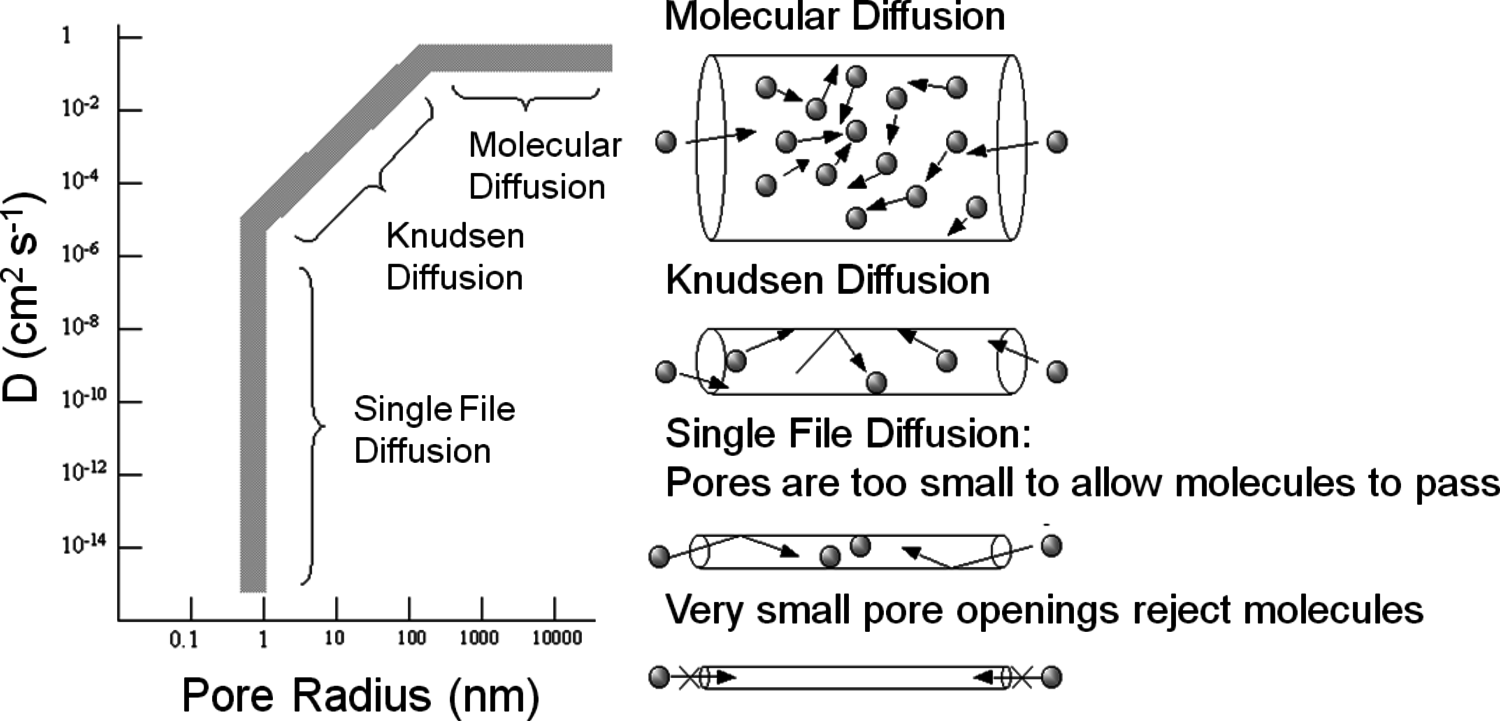
Fig. 9.9: Influence of pore size on the diffusivity (D) of gaseous molecules in porous materials. From Davis [7]
If both the reaction rate constant and the diffusivity of a reacting species are known or can be estimated, the concentration of that species undergoing reaction in a catalyst pellet can be calculated by the simultaneous solution of the differential equations that describe the reaction (mole balance in the pore) and diffusion (Fick’s Law) in the pore. This well-known system of equations in reaction engineering reveals a non-dimensional quantity that relates the characteristic rate of reaction to the characteristic rate of diffusion in the pore. For a first order reaction in a cylindrical catalyst pore, this quantity
 (also known as the Thiele modulus) is simply:

|
9.11 |
where L is the length of the catalyst pore, k is the first order rate constant and D is the diffusivity of the reacting species in the medium. The Thiele modulus for reactions other than first order can also be derived, but are not presented here for the sake of brevity. The concentration profile for a species A undergoing a first order reaction in a catalyst pore is presented in Figure 9.10 for different values of the Thiele modulus. The concentration of A in the pore (
 ) is normalized by the concentration at the pore mouth, which is at the external surface of the catalyst (
 ). The profiles in Figure 9.10 show that, for high values of the Thiele modulus, the reactant A is consumed rapidly in the pore and that diffusion of A into the pore is not fast enough to replace the A that is converted. Thus, for a value of
 =10 in Figure 9.10, the reactant A converts completely in the first half of the pore.
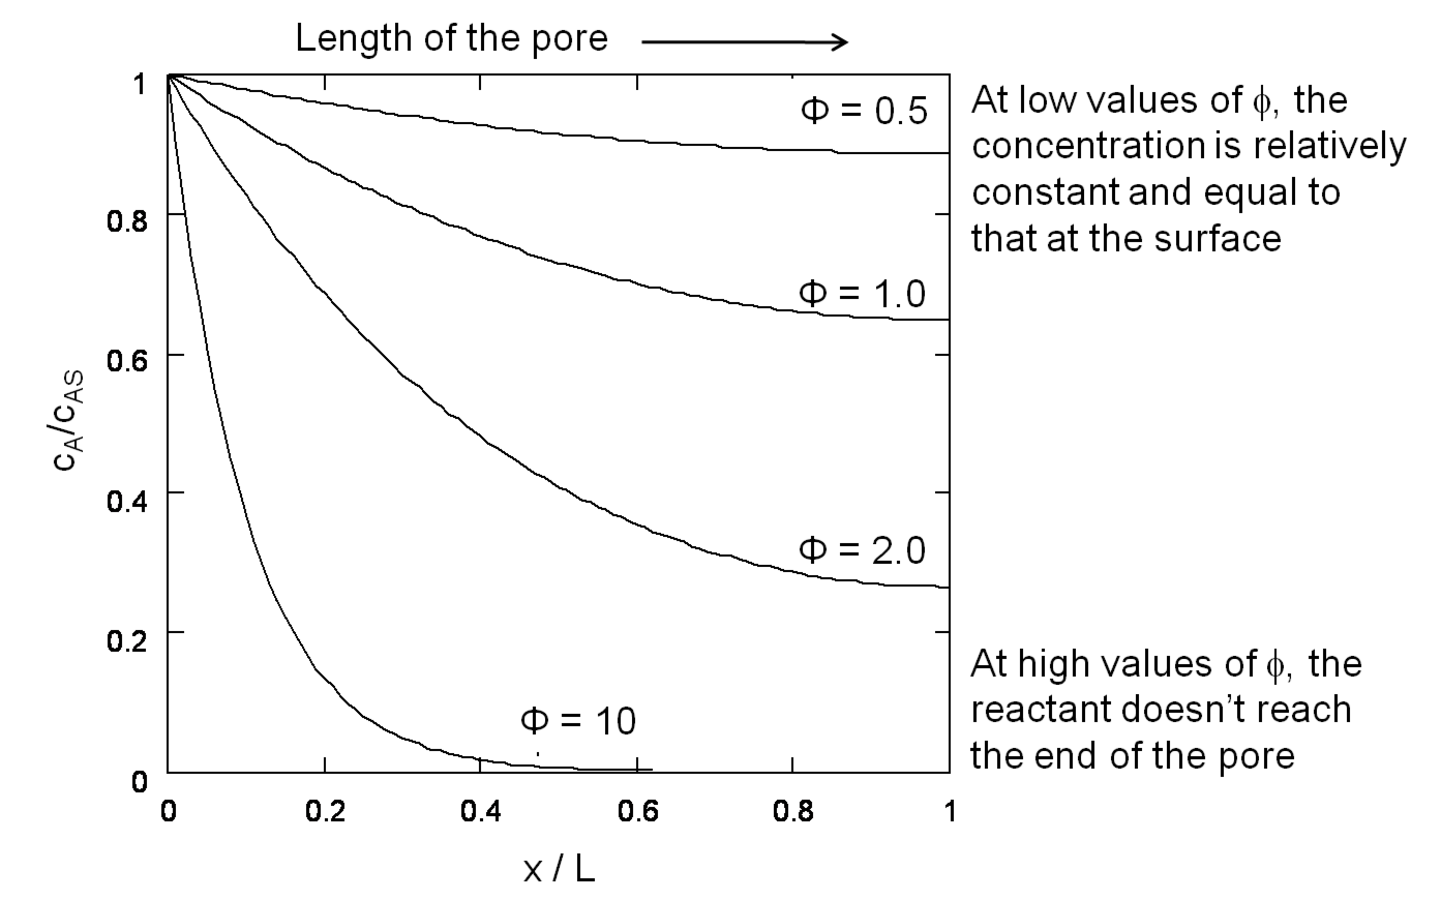
Fig. 9.10: Concentration profiles of reactant A converting in a first order reaction along the pore of a catalyst pellet, for various values of the Thiele modulus. Adapted from Davis [7]
This example illustrates the importance of properly balancing the rate of reaction to the rate of diffusion in a solid catalyst. If nanoparticles of an expensive catalytic metal, such as Pt, were deposited along the length of the pore to catalyze a desired reaction, half of the Pt would not even be involved in the reaction for the case in Figure 9.10 when
 =10, which is a very inefficient use of such a precious resource. Moreover, the observed rate of reaction is convoluted with the rate of diffusion when the concentration profile varies greatly down the length of a pore because the rate is a function of the reactant concentration. To measure the intrinsic rate of a catalytic reaction, one needs to ensure that all of the active sites in the catalyst pore are accessed and that there is a negligible concentration gradient of the reactants (and products, if there is product inhibition) along the length of the pore. The profile in Figure 9.10 for
 =0.5 shows that the concentration of reactant A is nearly constant along the length of the pore, which is the preferred circumstance for measuring the intrinsic reaction rate on a catalyst.
The Thiele modulus for any shape of catalyst pellet,
 0, is defined by

|
9.12 |
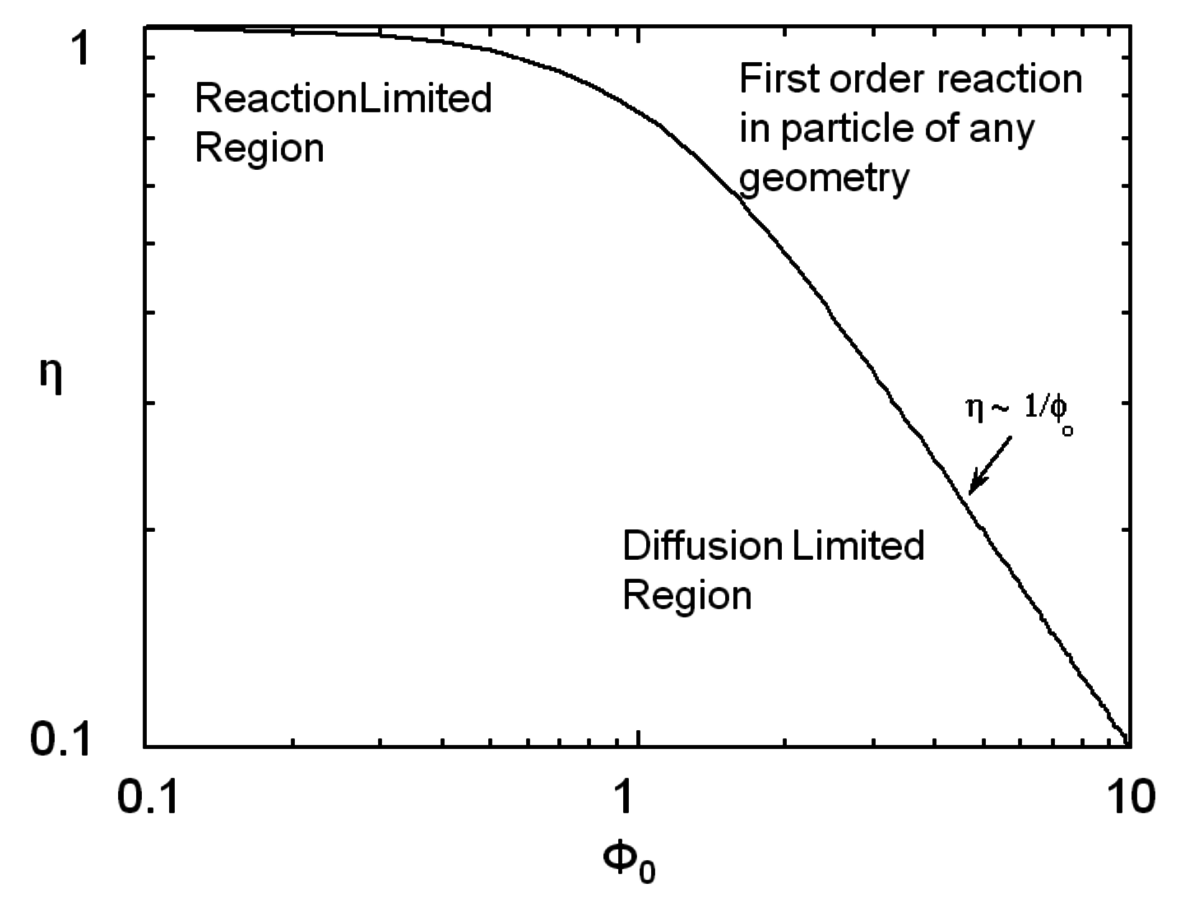
where Lp is the characteristic length associated with the catalyst particle shape determined by the ratio of the volume of the particle to its external surface area. The Thiele modulus is used to estimate how effectively a catalyst is being used in a reaction by calculating a term known as the effectiveness factor, η, which is defined as the observed reaction rate in a catalyst particle divided by the rate if it were not influenced by diffusion of the reactants. Figure 9.11 illustrates the relationship between the effectiveness factor and the Thiele modulus for a first order reaction in a porous catalyst of any geometry. The effectiveness factor approaches unity at low values of the Thiele modulus (
 0<<1), indicating that the rate is unaffected by diffusional limitations under these conditions. However, at high values of the Thiele modulus (
 0>>1), the effectiveness factor becomes much less than one and approaches the relationship defined by η=1/
 0, as depicted in Figure 9.11. Thus, to operate in a condition that is not influenced by the effects of mass transfer along the pore length, parameters such as catalyst particle size (which determines L) and reaction temperature (which affects k) need to be selected so that the Thiele modulus is much less than unity.
If the intrinsic reaction rate constant is unknown, then estimation of the Thiele modulus is quite difficult. Fortunately, Weisz and Prater developed a dimensionless parameter
 based on observable quantities to ascertain whether or not diffusional artifacts are influencing the observed rate [17]. If the so-called Weisz-Prater criterion shown below is satisfied, then there are no significant diffusional limitations in the system:

|
9.13 |
where robs is the observed reaction rate for an irreversible first order reaction,
 is the radius of a spherical catalyst pellet,
 is the effective diffusivity (the diffusivity multiplied by the porosity of the catalyst, typically 0.5, divided by its tortuosity, typically 3–4; see any text on reaction engineering for additional details) and CAS is the concentration of A at the external surface of the catalyst pellet.
 . From Davis [7]
Fig. 9.11: Plot showing how the effectiveness factor η is influenced by the Thiele modulus
. From Davis [7]
As an example, Xi and Davis used the Weisz-Prater criterion to evaluate the potential for diffusional limitations in their study of the transesterification of tributyrin with methanol to produce methylbutyrate, which was introduced earlier [12]. The reaction was run in a great excess of methanol so that the reaction profiles of tributyrin conversion to dibutyrin, monobutyrin, and eventually glycerol, as illustrated in Figure 9.5, could be easily modeled as pseudo-first order consecutive reactions. The initial reaction rate for the conversion of tributyrin in the first step was observed to be 8.0 x 10⁻⁵ mol s-1 g-1 at 333 K over a hydrotalcite catalyst. An estimate of the catalyst particle size derived from sieve trays was 0.038 mm and the initial tributyrin concentration was 0.7 mol L-1. The catalyst density and effective diffusivity of tributyrin in methanol were estimated to be
2 g cm-3 and 10-5 cm2 s-1. Substituting the appropriate values into the Weisz-Prater criterion resulted in a value of
 =0.3, which is less than unity and thus satisfies the criterion. A value of
 =0.3 corresponds to an effectiveness factor greater than 0.95, which indicates that effects of mass transfer limitations on the observed rate were negligible.
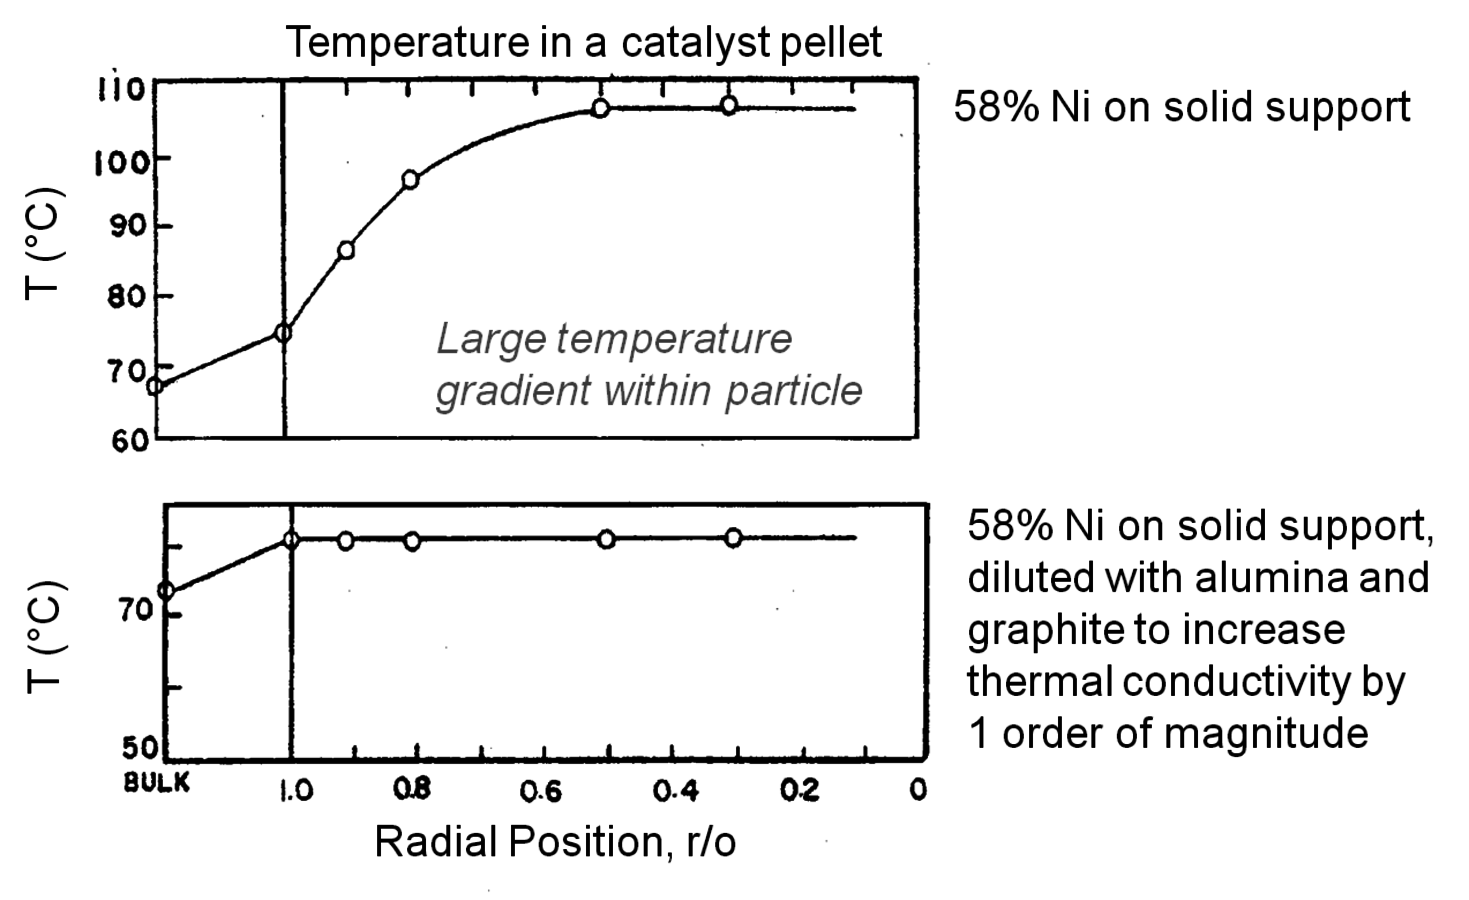
Temperature gradients in reactors and catalyst particles can also affect the observed reaction rate. Since the rate of most reactions increases exponentially with absolute temperature, a small gradient in temperature can impact the observed reaction rate in a major way. An interesting illustration of this phenomenon can be found in the work of Kehoe and Butt [18]. The temperature profile across the external film surrounding a catalyst pellet, as well as within the pellet itself, was monitored during the exothermic hydrogenation of benzene over a kieselguhr-supported Ni catalyst.
 , 86%
, 86%
 , Tfeed= 338–340 K, P = 1 atm,
 flow 9.0(±1.2) x 10-3 mol s-1. Measured rate: 2.44±0.08 x 10⁻⁶ mol s-1 g-1. Adapted from Kehoe [18]
Fig. 9.12: Measured external and internal temperature profiles during benzene hydrogenation over Ni catalysts. Feed conditions: 14%
, 86%
, Tfeed= 338–340 K, P = 1 atm,
flow 9.0(±1.2) x 10-3 mol s-1. Measured rate: 2.44±0.08 x 10⁻⁶ mol s-1 g-1. Adapted from Kehoe [18]
The upper portion of Figure 9.12 illustrates a 10 K temperature gradient across the external film, where the catalyst surface is hotter than the surrounding bulk fluid. However, the temperature increase within the catalyst particle itself was about 30 K because the heat generated inside the pellet, where most of the active Ni catalyst was located, could not be removed fast enough. The lower portion of Figure 9.12 illustrates how increasing the thermal conductivity of the catalyst pellet by adding alumina and graphite eliminated the temperature gradient in the pellet. However, the gradient across the external film still remained. The thermal gradients sometimes present during exothermal catalytic reactions raise the temperature of the catalyst pellet above that of the surrounding fluid. Therefore, the catalyst might be operating at an internal temperature that is much hotter than is realized or monitored, and the observed rate can be much higher than one would expect for a reaction taking place at the bulk fluid conditions. Indeed, the effectiveness factor of a pellet accomplishing an exothermic reaction can exceed unity because of this phenomenon.
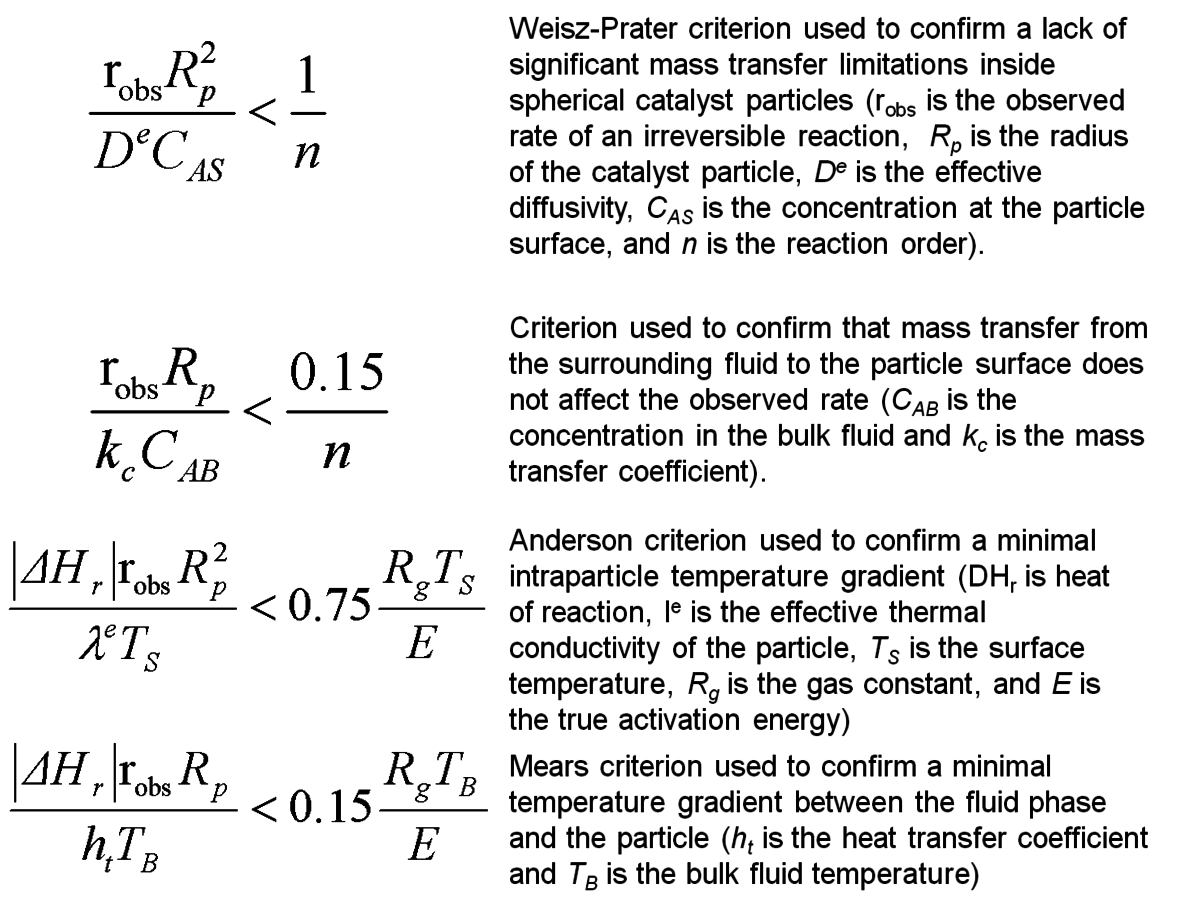
Fig. 9.13: Commonly-used criteria to check for the influences of mass and heat transfer artifacts in measured catalytic reaction rates. See Davis [7]
As discussed above, the Weisz-Prater criterion was developed to ascertain the importance of an intrapellet concentration gradient on the observed rate of a catalytic reaction. Likewise, criteria have been developed to elucidate the role of a concentration gradient through the external film surrounding a catalyst particle. Moreover, additional criteria analogous to those used for exploring mass transfer effects have been proposed to determine the importance of heat transfer effects in catalytic systems. A summary of commonly-used mass and heat transfer criteria is provided in Figure 9.13.
All of the criteria discussed previously were derived for rather specific conditions and require the knowledge of various system properties such as diffusivity, mass transfer coefficient, thermal conductivity, and heat transfer coefficient. Perhaps the best experimental verification for the lack of mass and heat transfer effects in kinetic data associated with solid catalyst particles is known as the Koros-Nowak criterion, which is sometimes referred to as the Madon-Boudart criterion. In this criterion, the turnover frequency of a reaction is measured on catalysts with at least two different loadings of active sites. If the turnover frequency is invariant with active site density and the same comparison is repeated at another temperature, then the measured rates are guaranteed to be free of artifacts from mass and heat transfer limitations.
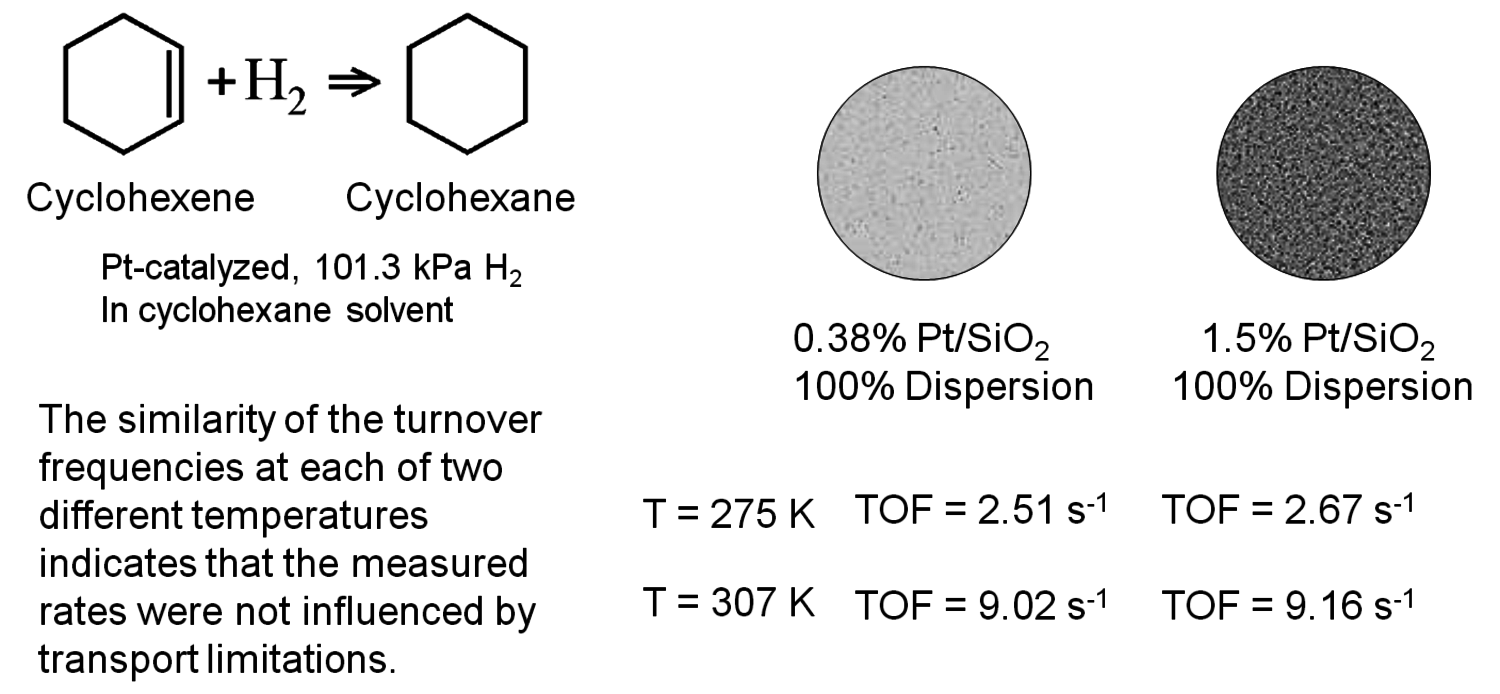
Fig. 9.14: Example of the Koros-Nowak criterion or the Madon-Boudart criterion for cyclohexene hydrogenation, based on data in [18]
Figure 9.14 illustrates the implementation of this criterion by Madon and Boudart, who studied cyclohexene hydrogenation over two different supported Pt catalysts, with a factor of 4 difference in Pt loading while maintaining a high dispersion [19]. As revealed in Figure 9.14, the turnover frequency on both catalysts was the same (~9.1 s-1) at 307 K, within experimental error. There is a minor complication that occurs with exothermic reactions since heat transfer limitations can sometimes compensate for mass transfer limitations and give an overall effectiveness factor of one. Therefore, if the TOF is the same for the two catalysts at another temperature, then the system is surely free of transport artifacts. Indeed, Figure 9.14 shows that the two Pt catalysts have a TOF of ~2.6 s-1 for cyclohexene hydrogenation at 275 K, confirming that kinetic results at 307 K and 275 K were not influenced by transport limitations.
Maris et al. used a form of the Koros-Nowak or Madon Boudart criterion to evaluate the kinetics of glucose hydrogenation to sorbitol over Ru nanoparticles supported silica and carbon [20]. In that study, a 50 wt% aqueous solution of glucose was hydrogenated with 80 bar
 at 373 K in a batch autoclave reactor containing the supported Ru catalyst. The rate was calculated from the initial slope of the sorbitol profile. Three different synthetic Ru/
 catalysts with Ru loadings ranging from 0.56 wt% to 4.47 wt% were tested, as well as a commercial sample of 5 wt% Ru/carbon. The particles of Ru on all of the silica-supported samples ranged from 1 to 2 nm as determined by
 chemisorption, whereas the Ru/carbon sample had slightly larger particles. The TOF of the reaction over all four samples was reported to be ~0.25 s-1, which is consistent with the idea that the kinetics are free from transport artifacts. It would have been preferable to have the same experiment reported at a different temperature. However, it is very unlikely that the compensation of heat and mass transfer would have occurred in exactly the same fashion over all four catalysts with two different supports. It should be noted that ideally the Koros-Nowak or Madon-Boudart criterion should be performed with identical metal particle sizes. This requirement originates from the fact that some reactions are structure sensitive, i.e., their TOF varies significantly as the metal particle size varies between 1 and 10 nm. Since hydrogenation reactions on transition metals are generally considered to be structure insensitive, small variations in metal particle size, such as the Ru catalysts in the previously discussed example, should not appreciably affect the observed TOF.
An excellent example of how transport criteria can be used to evaluate the kinetic data for a biomass-related chemical conversion can be found in the recent work of the Dumesic lab. Shabaker et al. studied the aqueous phase reforming of methanol and ethylene glycol at 483–493 K to produce hydrogen and carbon dioxide over alumina-supported Pt catalysts in an upflow, fixed-bed reactor attached to a gas-liquid separator at the reactor outlet [21]. The overall reaction network is quite complicated since side reactions such as the water gas shift reaction and hydrocarbon formation reactions can be observed. The Pt/alumina catalysts were prepared by incipient wetness impregnation followed by calcination and sieving to an appropriate pellet size. In this manner, the Pt loading within the powders could be controlled and the overall size of the supported catalyst pellets could be selected from a judicious choice of sieve trays. Chemisorption of CO was used to evaluate the dispersion of Pt on the alumina support as well as the Pt particle size. Conversions of 10 wt% solutions of methanol or ethylene glycol were kept below 3% to ensure that the concentration profile of reactants throughout the bed was fairly constant. Shabaker et al. explored the transport characteristics of the system under the most severe conditions of high temperature and high catalyst tortuosity. For the highest Pt-loaded catalyst with the largest pellet size, the Weisz-Prater parameter was calculated to be 6.7 and the internal effectiveness factor was reported to be 0.78, confirming that mass transfer within the Pt/alumina pellets limited the rate. However, pellets with much smaller size and Pt loading were not limited at all by transport artifacts. The authors concluded from their analysis that mass transfer limited the kinetics before heat transfer, and that the transport limitations through the external film surrounding the pellets is important only after resistance to mass transfer in the pores of the catalyst became significant. It should be noted that heat transfer limitations did not come into play in this particular system since the reaction medium was a liquid, which has a much higher thermal conductivity than a gas. Since the smaller pellet sizes appeared to be free of transport limitations, Shabaker et al. performed a Koros-Nowak or Madon-Boudart test on two small pellet Pt catalysts with Pt loadings of 0.16 wt% and 0.59 wt%. The TOF to produce
 at 483 K was similar at 4.3 and 4.2 min-1, respectively, which also suggests that the results are free of transport limitations. The TOF at 498 K was again similar at 9.4 and 9.0 min-1, which strictly satisfies the Madon-Boudart criterion for the invariance of TOF at two different temperatures.
9.7 Influence of Reactor Configuration
Private discussions among researchers reveal that sometimes different reactivity results are observed for biomass-related conversions in flow reactors compared to batch reactors. In principle, however, there should be little or no difference as long as the details of mixing and transport artifacts are correctly accounted for. In this section, a couple of recent examples will be discussed to highlight the major areas of concern when performing reactions in various reactor configurations.
Zhang et al. reported a detailed Langmuir-Hinshelwood kinetic expression for lactic acid (LA) hydrogenation/hydrogenolysis to propylene glycol in aqueous solvent over a supported Ru catalyst [22]:
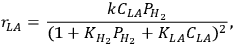
|
9.14 |
where the K values represent fitted adsorption constants and k is an overall rate constant. The authors performed an extensive analysis of the transport characteristics of their system and confirmed that their kinetic data were not significantly influenced by mass transfer artifacts. Therefore, the constants in their expression could be derived from reaction profiles in the batch reactor. Moreover, reasonable values of the heats of adsorption of LA and
 that were determined from the temperature dependence of the adsorption constants illustrated the thermodynamic consistency of the kinetic model. In follow-up work, Xi and Miller directly compared the conversion of lactic acid to propylene glycol over supported Ru in a multi-well batch system to that in a downflow trickle bed reactor in which gas and liquid are co-fed to a tube packed with the same catalyst [23]. The temperature was lowered to the point at which the researchers were satisfied that mass transfer limitations within the catalyst particles were not limiting the rates. Although the behavior of the batch reactor agreed very well with earlier work from the lab [22], the results from the trickle bed system deviated from the expected performance. The observed reactivity in a trickle bed reactor needs to account for the fact that some parts of the solid catalyst particles can be totally wetted by the liquid medium whereas other parts of the catalyst particles can be dry [24]. In the case of hydrogenation reactions, diffusion of hydrogen through the liquid film will be important in the wetted sections only. Thus, Xi and Miller explored by numerical methods four different models of the trickle bed reactor:
1A partially wetted catalyst in which one rate is used for the wetted fraction and another rate is used in the non-wetted fraction;
2a fully wetted catalyst;
3a partially wetted catalyst in which reaction only occurs in the wetted fraction;
4a fully wetted catalyst in which there are no gas-liquid or liquid-solid mass transfer resistances that affect the rate (the standard plug flow model).
The rigorous, partially wetted catalyst model agreed well with the experimental observations in the trickle bed reactor since the other models either underpredicted or overpredicted conversion of lactic acid. In summary, conditions of high liquid flow and low temperature (i.e., low rate and low conversion), allow results in the trickle bed reactor to approach those of fully wetted behavior so that the kinetics are similar to those in a batch reactor. However, under high conversion conditions, partial wetting of the catalyst and limitations from mass transfer can disguise the reaction kinetics. Additional analysis of trickle bed behavior accomplishing the conversion of a biorenewable molecule can be found in the recent published work of Xi et al., which involves the hydrogenolysis of glycerol to propylene glycol in alkaline aqueous solution over a Co/Pd/Re catalyst [25].
A particularly intriguing case of influencing reactivity by altering the reactor configuration is the oxidation of glycerol over supported Au catalysts. Gold is an excellent catalyst for the oxidation of glycerol in aqueous solution at mild conditions, but the reaction requires the presence of added base [26]. The reaction is generally believed to occur by formation of a glyceraldehyde intermediate that rapidly interconverts to dihydroxyacetone in basic solution. These reactive intermediates are then oxidized primarily to glyceric acid, with some researchers also reporting the presence of the product glycolic acid formed by C–C bond cleavage. Interestingly, very little of the diacids (tartronic and oxalic) are observed, even at high conversions of glycerol. A simplified schematic diagram of this sequence is presented in Figure 9.15.

Fig. 9.15: Simplified schematic representation of the reaction network for glycerol oxidation in alkaline water solution on Au catalysts
Pollington et al. performed glycerol oxidation utilizing a Au catalyst in a meso-scale structured downflow slurry bubble column reactor and compared the results to those obtained in a standard batch autoclave reactor [27]. The researchers were interested in exploring how the hydrodynamics of a three-phase system in which the Au catalyst was present in a moving slurry would affect activity and selectivity of the oxidation reaction. Their closed-loop recirculating flow reactor system involved passing the reactant liquid through the reactor after which the product stream was collected in a receiver vessel and then pumped back to the reactor. The oxygen was introduced at the top of the reactor where it was mixed with the liquid spray before entering the reaction zone. It should be noted that the receiver vessel was depressurized so that high pressure gas was only present in the reaction zone. The powder catalyst, 1 wt% Au on carbon, was evaluated for glycerol oxidation in a standard batch reactor at 333 K with a 0.6 mol L-1 aqueous solution of glycerol containing NaOH at the same concentration [28]. Under their particular conditions, glyceric acid was produced with nearly 100% selectivity at 30% conversion of glycerol. When the same catalyst powder was placed in the receiver vessel of the closed loop recirculating reactor, the measured activity and selectivity were substantially altered. In this reactor configuration, the Au/carbon powder catalyst was transported with the liquid to the reaction zone in which high pressure gas was added. The specific rate in the flow reactor was higher by several orders of magnitude compared to that observed in a batch autoclave at the same temperature and reactant concentration. Moreover, the selectivity of the reaction at 30% conversion of glycerol was about 50% glyceric acid with the remaining 50% being mostly dihydroxyacetone. The report claims that higher oxygen availability through improved oxygen transport in the three-phase recirculating loop reactor is responsible for the large difference in observed activity and selectivity compared to a standard batch autoclave reactor [27]. It should be noted, however, that a recent report by Zope et al. indicates the role of oxygen during glycerol oxidation is mainly that of an electron scavenger for the Au, whereas the hydroxyl species present in the alkaline solution is critical for the oxidation reaction [26]. Therefore, a complex interplay of oxygen, hydroxyl, gold, and glycerol is involved in structured reactors.
At about the same time as the work by Pollington et al. was published, Zope and Davis reported a comparison of glycerol oxidation in a batch reactor and in a fixed bed flow reactor, both containing Au nanoparticles supported on titania [29]. The flow reactor in this particular case was operated in a single pass, upflow mode in which high pressure oxygen was added to a pressured liquid stream that was fed to the fixed bed of Au/
 catalyst pellets. The optimum pellet diameter of 180μm was used to provide the lowest resistance to mass transfer without causing an unacceptable pressure drop in the reactor. Optimal liquid and gas flow rates were also determined to minimize impacts of transport limitations while limiting the conversion through the reactor. Despite the best attempts to facilitate mass transfer in the system, the rate of oxidation on supported Au was too high to guarantee all kinetic results were free of transport limitations. Nevertheless, important differences in glycerol reactivity between the flow reactor and the batch reactor were observed. In the autoclave reactor, the primary product was glyceric acid over Au/titania as expected, but substantial amounts of glycolic acid and trace amounts of diacids were also observed. The selectivity to diacid products (tartronic and glycolic) increased substantially in the fixed bed reactor compared to the very low values in the autoclave reactor. More specifically, diacid selectivity in a batch reactor was always less than 10% of the product mixture (and sometimes less than 5%) for various concentrations of NaOH and conversion levels of glycerol up to 83%. However, diacids were found in the effluent from the flow reactor at levels greater than 30% for even low levels of glycerol conversion and otherwise identical conditions. The turnover frequency in the flow reactor was about a factor of three lower than that in the batch system, which was likely the result of differences in the mass transfer characteristics of the two systems.
In summary, the results presented in Ref. 29 show how moving a Au catalyst from a batch system to a flow system can enhance diacid formation (the end of the reaction network in Figure 9.15) whereas the results in Ref. 27 illustrated how moving a Au catalyst from a batch system to a recirculating slurry reactor can shift the product distribution back to dihydroxyacetone (the beginning of the reaction network in Figure 9.15). In principle, the reaction should be entirely predictable from one reactor configuration to another as long as the details of the mechanism of the complex reaction network are known. In the case of Au-catalyzed oxidation of glycerol, important roles of solution phase reactions, alkalinity, oxygen transfer, and the Au catalyst in the reaction network prevent the use of simplistic reactor engineering models of performance.
9.8 Conclusions
The goal of this chapter is to emphasize important reaction engineering principles that need to be followed in the growing field of catalytic conversion of biorenewable molecules. The following list summarizes the key points regarding evaluation of catalytic reaction rates for chemical transformations in a variety of chemical reactors.
1Always report reaction rates instead of overall product yields or conversions. If possible, normalize the rate to the number of active sites in the reactor, thus producing a turnover frequency for the reaction.
2Always report the selectivity of a reaction together with the level of conversion. When comparing catalysts or reactors, be sure to compare selectivities of different systems at identical levels of conversion.
3Always evaluate the overall material balance in the system. This is especially important in the conversion of complex biorenewable molecules that can form a broad spectrum of products such as light gases, polar oxygenates, hydrocarbons, and tars.
4In addition to measuring the activity and selectivity of a particular catalyst, the stability should also be evaluated. Characterizing the catalyst during or after the reaction provides important clues to the modes of deactivation.
5For solid catalysts functioning in a liquid reaction medium, the reactivity of the solution needs to be evaluated as well as the amount of material leached from the solid.
6The reactor used to evaluate a particular chemical transformation should be selected based on the desired measurement. Reactors used for evaluating fundamental reaction kinetics, maximizing product yields, and performing pilot-plant scale tests are not necessarily the same.
7To evaluate intrinsic kinetics of a catalytic reaction, serious efforts to minimize or eliminate transport artifacts are needed, such as using a small catalyst pellet size, a high flow rate or high agitation rate, and a set of reaction conditions that ensures that the rate is not too high.
8In kinetic studies, an experimental check of the reaction rate by the Koros-Nowak or Madon-Boudart criterion should be performed to ensure the observed rates are not convoluted with transport phenomena.
9If the Koros-Nowak or Madon-Boudart criterion cannot be performed, empirical criteria should be used to estimate the importance of transport artifacts in the catalytic system.
10Transport phenomena in a catalytic system can cause unanticipated changes in activity and selectivity of a catalyst because of the complexity of the reaction mechanism. Since the observed behavior of a catalyst in one type of reactor may not translate to another type of reactor, a complete description of the reactor configuration needs to be provided.
Acknowledgments
The author acknowledges support for this work by grants from the U.S. National Science Foundation (CTS-0624608, OISE 0730277 and EEC-0813570).
Bibliography
[1] H.S. Fogler. Elements of Chemical Reaction Engineering. Upper Saddle River, NJ: Prentice Hall, 2006
[2] O. Levenspiel. Chemical Reaction Engineering. New York: Wiley, 1999
[3] R.W. Missen, C.A. Mims, C. M.. Introduction to Chemical Reaction Engineering and Kinetics. New York: Wiley, 1999
[4] G.W. Roberts. Chemical Reactions and Chemical Reactors. New York: Wiley, 2009
[5] L.D. Schmidt. The Engineering of Chemical Reactions. New York: Oxford, 1998
[6] G.F. Froment, K.B. Bischoff, K. B.. Chemical Reactor Analysis and Design. New York: Wiley, 2011
[7] M.E. Davis, R.J. Davis. Fundamentals of Chemical Reaction Engineering. New York: McGraw-Hill, 2003
[8] Y. Xi, R.J. Davis. Influence of Textural Properties and Trace Water on the Reactivity and Deactivation of Reconstructed Layered Hydroxide Catalysts for Transesterification of Tributyrin with Methanol J. Catal. 268: 307-317 (2009): 307-317.
[9] S.E. Davis, L.R. Houk, L. H., Tamargo L.R., T. L.. Oxidation of 5-hydroxymethylfurfural over supported Pt, Pd and Au Catalysts Catalysis Today 160: 55-60 (2011): 55-60.
[10] W.C. Ketchie, E.P. Maris, E. M.. In-situ X-ray Absorption Spectroscopy of Supported Ru Catalysts in the Aqueous Phase Chemistry of Materials 19: 3406-3411 (2007): 3406-3411.
[11] E.P. Maris, W.C. Ketchie, W. K., Murayama W.C.. Glycerol Hydrogenolysis on Carbon-Supported PtRu and AuRu Bimetallic Catalysts Journal of Catalysis 251: 281-294 (2007): 281-294.
[12] Y. Xi, R.J. Davis. Influence of Water on the Activity and Stability of Activated Mg-Al Hydrotalcites for the Transesterification of Tributyrin with Methanol J. Catal. 254: 190-197 (2008): 190-197.
[13] Y. Xi, R.J. Davis. Intercalation of Ethylene Glycol into Yttrium Hydroxide Layered Materials Inorganic Chemistry 49: 3888-3895 (2010): 3888-3895.
[14] N.T.S. Phan, M. Van Der Sluys, M.V.D. S.. On the Nature of the Catalytic Species in Palladium Catalyzed Heck and Suzuki Couplings—Homogeneous or Heterogeneous Catalysis, a Critical Review Advanced Synthesis& Catalysis 348: 609-679 (2006): 609-679.
[15] B. Maier, C. Dietrich, C. D.. Correct Application of the Sulphite Oxidation Methodology of Measuring the Volumetric Mass Transfer Coefficient kLa under Non-Pressurized and Pressurized Conditions Trans. IChemE 79: 107-113 (2001): 107-113.
[16] W.C. Ketchie, M. Murayama, M. M.. Promotional effect of hydroxyl on the aqueous phase oxidation of carbon monoxide and glycerol over supported Au catalysts Topics in Catalysis 44: 307-317 (2007): 307-317.
[17] P.B. Weisz, C.D. Prater. Interpretation of Measurements in Experimental Catalysis Advances in Catalysis 6: 143-196 (1954): 143-196.
[18] J.P.G. Kehoe, J.B. Butt. Interactions of Inter- and Intraphase Gradients in a Diffusion Limited Catalytic Reaction AIChE J (American Institute of Chemical Engineers Journal) 18: 347-355 (1972): 347-355.
[19] R.J. Madon, M. Boudart. Experimental Criterion for the Absence of Artifacts in the Measurement of Rates of Heterogeneous Catalytic Reactions Industrial & Engineering Chemistry Fundamentals 21: 438-447 (1982): 438-447.
[20] E.P. Maris, W.C. Ketchie, W. K., Oleshko W.C.. Metal Particle Growth During Glucose Hydrogenation over Ru/SiO Journal of Physical Chemistry B 110: 7869-7876 (2006): 7869-7876.
[21] J.W. Shabaker, R.R. Davda, R. D., Huber R.R., H. R.. Kinetics of Aqueous-Phase Hydrogenation of Lactic Acid to Propylene Glycol. Journal of Catalysis 215: 344 (2003): 344.
[22] Z. Zhang, J.E. Jackson, J. J.. Industrial & Engineering Chemistry Research 41: 691 (2002): 691.
[23] Y. Xi, D.J. Miller. Correlation of Reaction Rates for Lactic Acid Hydrogenation in Batch and Trickle Bed Reactors. In: Proc. 2009 Annual Meeting of the American Institute of Chemical Engineers . 2009. .
[24] A. Dietz, A.M. Julcour, A. J., Wilhelm A.M.. Selective Hydrogenation in Trickle-Bed Reactor: Experimental and Modelling including Partial Wetting Catalysis Today 79-80: 293 (2003): 293.
[25] Y. Xi, J.E. Holladay, J. H., Frye J.E., F. J., J.G. Frye. A Kinetic and Mass Transfer Model for Glycerol Hydrogenolysis in a Trickle-Bed Reactor. Organic Process Research & Development 14: 1304-1312 (2010): 1304-1312.
[26] B.N. Zope, D.D. Hibbitts, D. H., Neurock D.D.. Reactivity of the Gold/Water Interface During Selective Oxidation Catalysis Science 330: 74-78 (2010): 74-78.
[27] S.D. Pollington, D.I. Enache, D. E., Landon D.I., L. D., P. Landon, P. L., Meenakshisundaram P.. Enhanced Selective Glycerol Oxidation in Multiphase Structured Reactors Catalysis Today 145: 169-175 (2009): 169-175.
[28] S. Carrettin, P. McMorn, P. M., Johnston P., J. P., P. Johnston. Oxidation of Glycerol using supported Pt, Pd and Au Catalysts Physical Chemistry Chemical Physics 5: 1329-1336 (2003): 1329-1336.
[29] B.N. Zope, R.J. Davis. Influence of Reactor Configuration on the Selective Oxidation of Glycerol over Au/TiO Topics in Catalysis 52: 269-277 (2009): 269-277.