Chapter structure
- 8.1 Introduction
- 8.2 Biomass Composition
- 8.3 Measuring Biomass Composition: Forage and Fiber Analysis
- 8.4 Summative Compositional Analysis of Biomass Feedstocks
- 8.5 Summative Compositional Analysis of Pretreated Biomass Slurries and Liquors
- 8.6 Summative Mass Closure-Calculations, Troubleshooting, and Errors
- 8.7 Uncertainty in the Primary Measurements
- 8.8 Propagation of Uncertainty in Primary Measurements
- 8.9 Room for Improvement in Biomass Compositional Analysis
- 8.10 Rapid Biomass Analysis via NIR
- 8.11 Conclusions
- Bibliography
- Appendix
- Footnotes
8.1 Introduction
Biomass, or plant derived material, is of interest as a fuel source for several reasons. Foremost, when managed wisely, it has the potential to become a sustainable source of hydrocarbon fuels. It is a leading near-term solution to fill the gap between growing global energy demand and dwindling petroleum availability. The conversion of biomass to renewable fuels has the potential to be carbon neutral, where carbon dioxide produced during fuel production and consumption is utilized by the next generation of plants during growth cycles [1]. Finally, many geographic areas contain some type of plant material that can be utilized as a fuel source, eliminating the need for long-distance fuel transport.
Many types of biomass are inherently heterogeneous, especially lignocellulosic biomass, or non-edible plant material. Biomass derives from living, growing plants that change during their life cycle. Since plants are a living organism, the polymer matrix of the material is very complex and difficult, or impossible to control [2]. Figure 8.1 demonstrates the variety of constituents within the anatomical fractions of a single plant. The variable nature of biomass feedstocks represent a risk in processing environments, as processes can be difficult to optimize without steady state input.
Cellulosic biomass feedstocks can be processed in several ways to make fuels. In the biochemical conversion process, the cellulosic biomass is converted to monomeric carbohydrates, which are then fermented to ethanol, butanol, or other liquid fuels. Alternative conversion techniques include thermochemical conversion to either pyrolysis oil or synthesis gas, or catalytic conversion of the monomeric carbohydrates in aqueous solution. The techniques for biomass feedstock compositional analysis are largely independent of the conversion process, although the analyses of process intermediates are obviously dependent on the conversion process. We are writing this work from the perspective of our experience in biochemical conversion research.
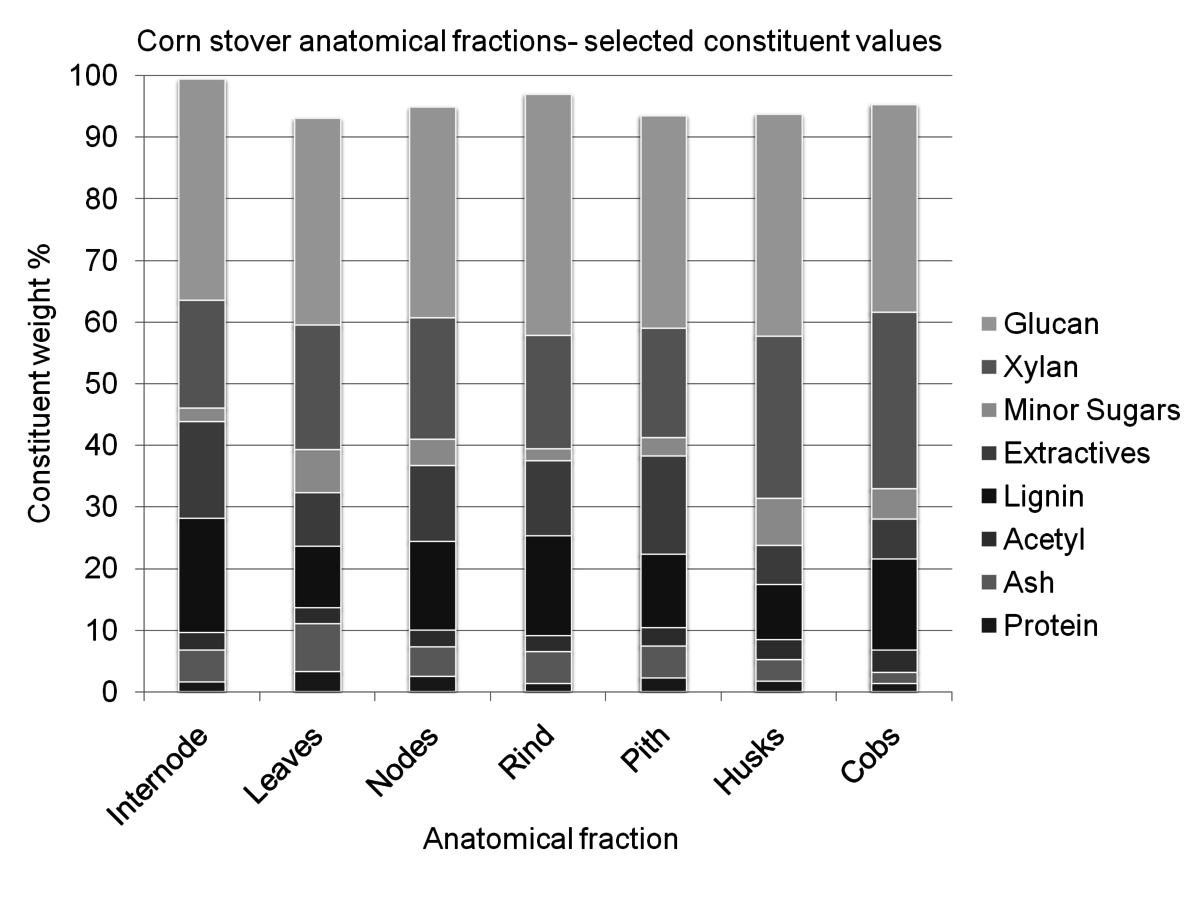
Fig. 8.1: This figure demonstrates the variety of constituents within a single type of biomass separated into individual fractions. This sample of corn stover was separated by hand into anatomical fractions, and each fraction was individually analyzed. For visual simplicity, some constituents have been grouped, such as extractives and minor sugars.
In this chapter, we first review the constituents of biomass, and then discuss methods used to measure both feedstocks and biochemical conversion process intermediates, concentrating primarily on the so-called fiber analysis methods used in our laboratories. We discuss the uncertainties associated with these methods, and the influence of these uncertainties on derived values from experiments. Finally, we briefly discuss new developments in the rapid analysis of biomass using spectroscopic methods.
8.2 Biomass Composition
Plant derived biomass consists of many different constituents. A detailed description of biomass composition can be found at http://www1.eere.energy.gov/biomass/feedstock_glossary.html, but the principal constituents are structural carbohydrates, lignin, protein, ash, and non-structural materials.
The structural carbohydrates are typically divided into two groups, cellulose and hemicellulose. Cellulose is a polymer with a rigid structure of repeating glucose units, and is highly stable and resistant to chemical attack. It has a high degree of hydrogen bonding, which contributes to the rigidity of the structure [3]. Hemicellulose is a polymer consisting of shorter, highly branched chains of sugars. Hemicellulose can contain five-carbon sugars, such as xylose and arabinose, as well as six-carbon sugars, such as glucose, galactose, and mannose. The backbone may be mannose or xylose, with a variety of side chain sugars [4]. The branched character of hemicellulose causes it to be more amorphous and easier to break down compared to cellulose.
Aside from carbohydrates, the major structural materials present in lignocellulosic biomass include lignin, ash, and protein. Lignin is a polymeric structure that is highly aromatic and branched. It has a high molecular weight and a complex structure. Lignin assists in holding the cells together, provides the plant with rigidity, and gives it some resistance to insect and biological degradation. Ash is any inorganic matter, typically silica. Protein is a compact structure made up of chains of amino acids.
Materials that are not a part of the cellular structure and can be removed with solvents are termed extractives for the purpose of biomass compositional analysis. This is an inexact definition; extractives can include waxes, saps, and fats. Different solvents remove different portions of the soluble material. For example, a water extraction can remove surface material such as soil and fertilizers and can also remove non-structural, low molecular weight carbohydrates, like sucrose, that were present in the plant when it was harvested. Extractions with ethanol, toluene, or other organic solvents can isolate waxes, fats, and resins.
8.3 Measuring Biomass Composition: Forage and Fiber Analysis
Determining the composition of biomass is a detailed and complex undertaking when all of the constituents are individually measured. The goal of most biomass analysis for fuels is summative mass closure, where all of the constituents are accounted for and 100% of the weight of the material is classified. Quantifying all of the constituents is vital to calculate fuel conversion yields and mass balance [5]. Though a single constituent may make up a very small portion of the biomass, when dealing with tens or hundreds of tons of material in a processing environment, even one or two weight percent of the material can comprise a significant amount of material. Without analysis, the planning for disposal or potential use of every fraction becomes impossible.
8.3.1 Forage Analysis Methods
Forage analysis methods are widely used in agriculture to assess the quality of feedstocks for animal nutrition. The two most widely used forage analysis methods are neutral detergent fiber (NDF) and acid detergent fiber (ADF). A complete discussion of all forage analysis methods can be found at the National Forage Testing Association [6].
The NDF and ADF analysis methods are essentially extraction techniques; the reported value is the mass fraction remaining after contacting the biomass samples with an acidic or neutral surfactant solution, rinsing, and drying. Acid detergent lignin (ADL) is a classical Klason lignin analysis performed on the ADF residue. These methods are sometimes combined to provide estimates of hemicellulose (NDF-ADF) and cellulose (ADF-ADL). The assumption behind the hemicellulose calculation is that NDF removes all non-structural material while ADF removes non-structural material and hemicellulose, so the difference between these results is hemicellulose. The cellulose calculation assumes that ADF leaves behind only cellulose and lignin, which is subsequently removed by ADL.
Because they are extractive techniques, NDF and ADF methods do not provide information about the structural carbohydrates in the same manner as the fiber analysis methods discussed below. We recently attempted to correlate forage and fiber analysis measurements and found that the highest correlations between NDF and/or ADF was with the extractives measurement performed as part of the fiber analysis method [7]. We found little correlation between the forage analysis results and the fiber analysis results when the latter were calculated on an extractives-free basis. Thus, we found the forage analysis methods relatively uninformative for the purposes of structural carbohydrate analysis.
8.3.2 Fiber Analysis Methods
Fiber analysis methods for biomass have a long history, dating back more than 100 years. The methods we use are built on the knowledge gleaned from decades of biomass analysis research [4,8]. Essentially, all fiber analysis methods begin with an extraction step to remove the non-structural material from the biomass sample. The extracted material then undergoes acid hydrolysis (typically a concentrated acid hydrolysis step performed at room temperature followed by a dilute acid hydrolysis step at elevated temperature) to break down the structural carbohydrates to their monomeric forms, which can then be measured chromatographically. Lignin is typically measured gravimetrically as the acid-insoluble residue.
Many different laboratories use fiber analysis methods. Recently, ten different laboratories participated in a round-robin analysis [9] of the four biomass reference materials available from the National Institute of Standards and Technology (sugarcane bagasse, poplar, pine, and wheat straw) [10]. Not surprisingly, different laboratories got different results during the analysis.
Fiber analysis methods are empirical in nature; if they are executed with care they will provide repeatable results over time. However, our experience is that small deviations in a standard method can have large impacts on the measured constituent values. For example, we have found that inadequate mixing of the hydrolysate during the dilution from the very viscous first stage hydrolysis to the less viscous and more dilute second stage acid hydrolysis will lead to irreproducible results due to uneven hydrolysis, and failure to adequately mill pretreated solids results in skewed lignin and carbohydrate values due to incomplete hydrolysis.
In the following sections, we discuss the fiber analysis methods in use at the National Renewable Energy Laboratory for biomass compositional analysis. Again, other laboratories have developed fiber analysis methods that can also provide robust, reproducible results. Our goal in this work is to describe in detail the methods we use to give the reader an in-depth understanding of the details of these methods and to help researchers using these methods to improve their techniques by learning about the issues we have faced using these methods.
8.4 Summative Compositional Analysis of Biomass Feedstocks
Researchers at the National Renewable Energy Laboratory (NREL) have developed a system of individual published methods for the summative mass closure analysis of biomass based on classical fiber analysis methods. Figure 8.2 demonstrates the high level of interest in these procedures. A detailed lineage of these methods can be found in a recent publication [11]. We refer to these incremental methods as Laboratory Analytical Procedures (LAPs). The LAPs are publicly available at http://www.nrel.gov/biomass/analytical_procedures.html, and updates are posted as they are available. A number of these procedures have been adopted as ASTM standards as well.
By combining the appropriate LAPs, the goal is to break the biomass sample down into constituents that sum up to 100% by weight. Some of these constituents are individual components, such as individual carbohydrates, and some are groups of compounds, such as extractable material. However, the goal of these analyses is to characterize all of the material in the sample. If the constituents do not sum up to 100%, the analysis should be revisited to determine missing or incorrectly quantified components. There are several points within the compositional analysis where decisions must be made to optimize the analysis. Some of these decisions are based on the type of biomass present, and some decisions must be made to accurately measure all components that are present. We provide a discussion to aid these decisions below. The Summative Mass Closure LAPs provide an overview of the individual LAPs, detail how the individual LAPs integrate, and highlight many of the pitfalls that can cause an analysis to fail [12,13].
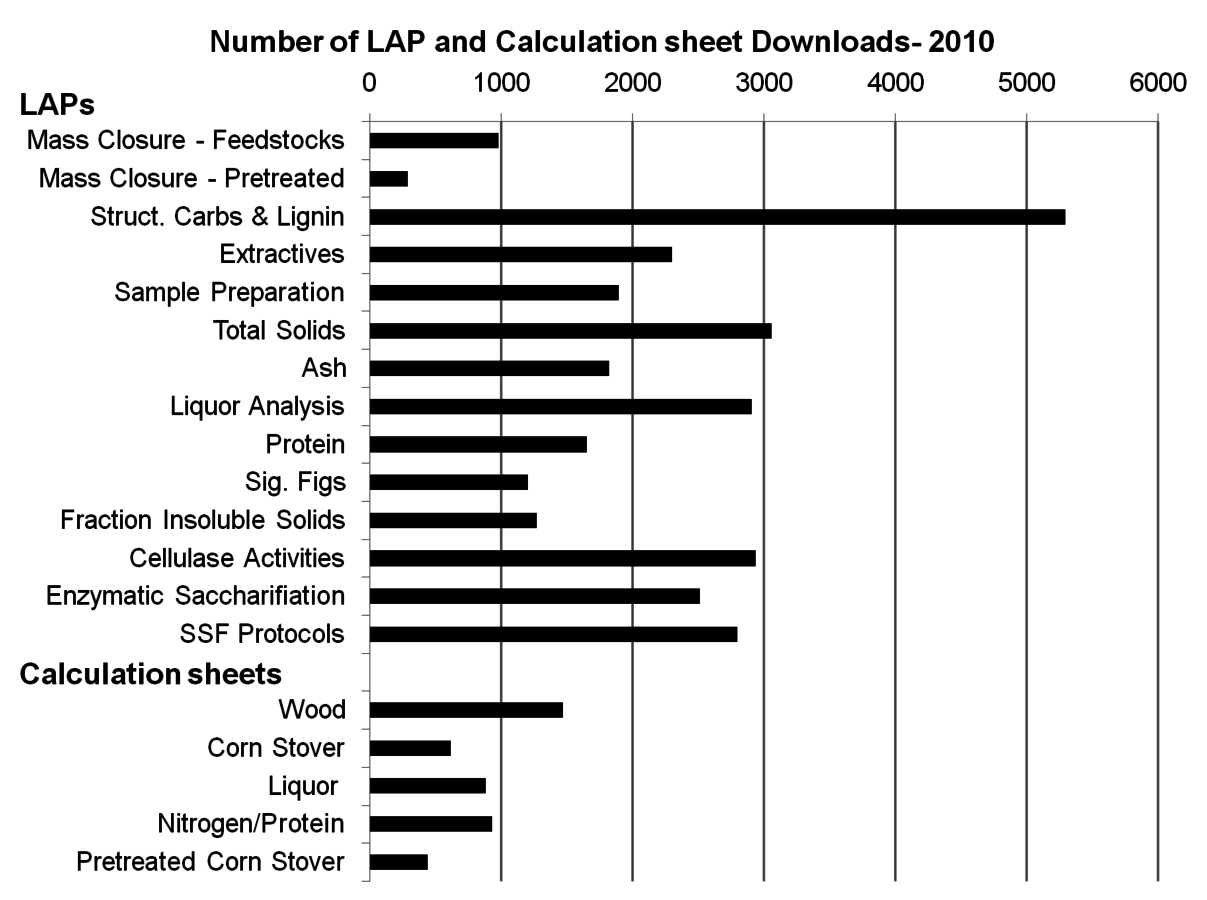
Fig. 8.2: The high level of interest in NREL’s Laboratory Analytical Procedures is captured by the number of downloads of the LAPs in 2010. The core hydrolysis procedure is contained in the Structural Carbohydrates and Lignin LAP, which alone was downloaded over 5000 times. The calculation sheets designed to accompany the LAPs were downloaded a combined 4000 times. Interestingly, the majority of downloads were for woody feedstocks.
In the following sections we summarize the process we use to perform bio- mass compositional analysis. Reading these sections carefully and completely is NOT a substitute for reading and understanding the complete procedures. The LAPs have been optimized for corn stover and generally work well on woody feedstocks and herbaceous materials such as switchgrass, sorghum, and miscanthus, although minor adjustments may be necessary. Some LAPs are not appropriate for chemically or thermally altered material. Unusual feedstocks will typically require some method development to capture constituents not included in the LAP suite.
8.4.1 Sample Preparation
The details of sample preparation are found in the NREL LAP Preparation of Samples for Compositional Analysis [14]. The first step in biomass analysis is preparing the sample for analysis. Biomass samples typically arrive from the field in an intact or semi-intact state that includes soil or other debris and a significant moisture content. Proper sample preparation will minimize interferences in subsequent compositional analyses. Sample drying, particle size reduction, and potential sieving are discussed in this LAP.
To be accurately analyzed, the sample must be less than 10% moisture by weight and be milled to a certain particle size. This LAP covers several methods for drying the sample. Air-drying, the simplest option, can be used when ambient humidity and temperature allow the sample to dry to specified conditions without degrading. When ambient humidity is too high to permit this technique, samples must be monitored for degradation and microbial growth until the moisture content is less than 10% by weight. Samples can also be dried at 45 °C in a convection oven. This method should be used with care, as temperatures exceeding 45 °C can cause thermal degradation. Lyophilization, or freeze-drying, is also covered. This method can be used for samples that need to be dried under mild conditions or are very wet. Lyophilization is an unsuitable technique for large or bulk samples and those with large pieces of biomass.
After drying, the sample needs to be reduced to a uniform specific particle size. Since the subsequent methods are optimized for a -20/+80 mesh particle size, milling the sample will likely be necessary [15,16]. Knife milling is the preferred method, as screens can ensure consistent particle size. Prior to milling, the sample must meet moisture requirements discussed above. Milling wet samples can result in the degradation of the sample during milling. The mill must be monitored to ensure that it is operating at optimal temperature. An overheated mill can cause extractable material to separate from the biomass and deposit on the heated metal portions of the mill or may partially degrade the biomass. Milling with dry ice is not recommended, as contaminants potentially present in dry ice leave a residue on the biomass. Care should also be taken to ensure that the biomass fed into the mill has been reduced to an appropriate size, and that the mill does not bind or overheat.
Sieving a sample is occasionally necessary, but the composition of the bio- mass may change with sieving. Specifically, the fraction of the biomass removed during sieving may be higher in ash content than the bulk sample. Sieving should only be used when necessary, such as with samples containing an ash content high enough to interfere with later analyses. Sieving of biomass prior to acid hydrolysis was introduced to prevent excessive degradation of small particles during analysis. The acid hydrolysis steps were optimized for a -20/+80 mesh particle size, and deviation to a larger particle size distribution can cause structural carbohydrates to be incompletely dissolved into solution. Such deviation will result in higher acid insoluble lignin values and lower overall structural carbohydrates, especially cellulose. Deviation from the recommended particle size to a smaller particle size may result in degradation of the structural carbohydrates, contributing to an overproduction of sugar degradation products, which can complicate the acid soluble lignin measurement.
Sieving was originally developed for the analysis of very homogeneous materials, such as wood samples. However, when herbaceous feedstocks were first analyzed it became apparent that the heterogeneity of the feedstock caused partitioning of components during sieving. Therefore, for feedstocks with a high degree of heterogeneity, such as herbaceous materials, sieving is not recommended. Also, reactor processes usually require whole sample composition, and mathematically adding the measured composition of a sieved fraction back into the bulk sample can be complicated.
Sieving can be performed to purposefully remove a portion of the higher ash content fraction. This should only occur when the ash content of the extracted biomass is high enough to interfere with hydrolysis. Further discussion of ash interference is included with the hydrolysis discussions.
Once prepared, the biomass should be carefully stored. Airtight storage containers will prevent unwanted moisture changes. However, biomass can settle and separate into fractions while stored, even for a short while. When sampling a stored sample, homogenize the sample well prior to removing an aliquot, to ensure a representative sample. Large samples may need specific homogenization procedures, such as riffle splitting or the cone and quartering technique, prior to removing a subsample.
8.4.2 Measuring Total Solids
The details of determining moisture content, or total solids content, are found in LAP Determination of Total Solids in Biomass and Total Dissolved Solids in Liquid Process Samples [17]. Since all measured constituents are reported on a dry weight basis, the moisture content of the sample must be measured several times throughout the analysis. Reporting values on a dry weight basis means that the water weight of the sample has been mathematically removed from the constituent value. That is, the ash content of a biomass sample that contains 50% moisture and 10% ash is 20% on a dry-weight basis. We believe that this is the best way to compare samples on a consistent basis. As this measurement is used to correct all other measurement during the analysis, it is one of the most critical measurements. Any errors made during measurement of moisture will propagate through the remaining values and lead to increased uncertainties.
The moisture content of biomass can change very quickly (sometimes within minutes), depending on how the sample is stored as well as ambient conditions in the laboratory. Therefore, every time a sample is weighed for an analysis, a concurrent moisture determination must be performed. The LAP describes two methods of moisture determination, one using a 105 °C convection oven and one using an automatic infrared moisture analyzer. This LAP should not be used for samples that may chemically change when heated, such as for pretreated biomass samples that contain residual acid or base.
This LAP also discusses the measurement of the total solid material in pretreated slurries. That portion of the method is discussed in the slurry analysis section. The sample aliquot used for %Total Solids analysis has been exposed to elevated temperatures and thermal degradation, and should not be used in further analyses, with the exception of determining ash content.
8.4.3 Measuring Ash
Inorganic materials are present in both whole and structural, or extracted, biomass samples. They are the result of inorganic matter bound into the plant structure or external additions such as surface fertilizer. In addition to contributing significantly to total mass closure, inorganic material may interfere with acid hydrolysis. LAP Determination of Ash in Biomass describes two methods for the determination of %Ash in biomass [18]. The LAP provides instructions for ash determination in a muffle furnace set to 575 °C with prior preignition, and describes the use of a ramping muffle furnace with no preignition. Our experience has shown that, when executed correctly, the two methods provide equivalent results.
8.4.4 Measuring Protein
Herbaceous feedstocks can contain a significant amount of protein in the stalks and leaves. Measurement of protein in biomass is performed indirectly by measurement of nitrogen content and the use of a nitrogen-to-protein conversion multiplier. The typically used nitrogen-to-protein conversion value of 6.25 is not accurate for biomass proteins [19-21]. Instead, an appropriate conversion factor is determined by measuring the individual amino acids in the feedstock of interest. Because a portion of the protein is often removed during the extraction process, protein analysis is performed on both whole and extractives-free materials. Details of this procedure can be found in LAP Determination of Protein Content in Biomass [19].
Protein can potentially interfere with lignin measurements in subsequent analyses, since lignin is determined gravimetrically as the acid insoluble residue after analytical hydrolysis, and not all protein in the sample is still soluble after hydrolysis. By measuring the protein prior to hydrolysis, we can correct for this interference. Determining the amount of protein condensed with the acid insoluble residue is difficult, as the protein will have been altered during condensation. The nitrogen content of the acid insoluble residue and the hydrolysate can be determined and the amount of protein in the acid insoluble residue estimated from these values. Alternately, all of the protein can be assumed to be in the acid insoluble fraction or the hydrolysate fraction, and all analyses can be compared on a consistent, if not accurate, basis.
8.4.5 Measuring Extractives
The details of extracting biomass samples are found in NREL LAP Determination of Extractives in Biomass [21]. Extractives are the non-structural portion of biomass, those constituents that are not chemically bound to the structure of the material. Some biomass types can contain over thirty percent by weight extractable material. Since some extractives are destroyed in subsequent analyses, and some interfere with downstream procedures, the extractable material must be removed and quantified prior to further analyses. Different solvents remove different types of non-structural material [20,22]. We typically use sequential water and ethanol extractions, although a single step ethanol extraction is sometimes adequate. Extraction with ethanol is required for all biomass types to ensure the removal of waxy materials that co-precipitate during filtration of the acid hydrolysate. When analyzing woody feedstocks, ethanol extraction alone is generally sufficient to remove interfering extractable material, including sap and resins. Herbaceous feedstocks require water extraction prior to the ethanol extraction. We use two different types of extraction apparatus: the traditional Soxhlet technique and automated Accelerated Solvent Extractor (Dionex ASE). The automated unit provides higher sample throughput than the Soxhlet method.
Nonstructural water soluble components commonly removed include inorganic material in the form of soil or fertilizers, proteins that are easily washed from the biomass, and a diverse array of carbohydrates, especially sucrose. Sucrose, a dimer of glucose and fructose, is of particular interest to fermentation and can be abundant in herbaceous plants, but it is easily degraded during acid hydrolysis. Measurement of the water-soluble sucrose from biomass allows for better quantification of the structural glucose present in a feedstock as well; during acid hydrolysis sucrose will break down to fructose and glucose. The LAP describes the sampling of the water extractable material to determine sucrose concentration. While the remaining array of small quantity analytes can be individually determined [23], the process is generally too expensive and time consuming for a standard analysis, so they are grouped into a single category.
Although extraction is the first major step in the analysis process, compositional data are typically reported on a “whole biomass” basis. Since extraction values, like the moisture determinations discussed above, are used to correct subsequent measurements, the extractives content is a critical measurement. Any errors made in the determination of the extractives content will propagate though all structural material and increase the uncertainties of those components.
Note that herbaceous feedstocks are typically higher in inorganic materials (commonly soil or fertilizer) and protein than woody feedstocks. The water extraction process will remove some of these materials; therefore ash and protein measurements are recommended both before and after extraction.
8.4.6 Measuring Structural Carbohydrates and Lignin
Structural carbohydrates and lignin make up the bulk of most feedstocks and often represent the most interesting portions. LAP Determination of Structural Carbohydrates and Lignin in Biomass describes the acid hydrolysis and subsequent analyses of acid soluble and acid insoluble portions [24]. It describes the preparation and two-stage sulfuric acid hydrolysis of the sample. After hydrolysis the solids are separated from the liquid and the fractions are analyzed separately. Acid soluble lignin and acid insoluble lignin are combined to calculate total lignin content. This LAP also describes carbohydrate analysis of the liquid fraction via high pressure liquid chromatography (HPLC), including preparation of standards, hydrolysate neutralization, HPLC method setup, and acetyl analysis. The LAP includes the use of sugar recovery standards, which are used to correct for loss of carbohydrates during hydrolysis.
The determination of carbohydrates using this method requires that all carbohydrates be in monomeric form. The presence of carbohydrate oligomers indicates incomplete hydrolysis, and those carbohydrates will not be measured. During hydrolysis, the conversion of polymers to monomers in the carbohydrates results in the addition of a hydrogen and a hydroxyl group to each monomer. An anhydro correction is used to mathematically convert the monomeric values back to a structural polymeric value.
Sugar recovery standards (SRSs) are used to account for sample sugar degradation during the dilute sulfuric acid step. SRSs are used to mimic the behavior and degradation of sample monomers. Since these values can fluctuate depending on a variety of factors, SRSs are included with every sample analysis. They are independent from the sample but are run in parallel. Because carbohydrate concentration will affect degradation levels, it is imperative to mimic the sample carbohydrate concentrations as closely as possible in the SRSs. Since this correction is critical to all measured sugar concentrations, duplicate or triplicate SRSs are recommended. It is understood that monomeric sugars behave differently during hydrolysis than polymeric sugars. Due to the difficulty of obtaining pure polymeric sugars, monomeric versions are used for the SRS determination.
LAP Determination of Structural Carbohydrates and Lignin in Biomass also details the steps necessary to determine acid insoluble residue, including filtration of the hydrolysate and determination of the ash content of the residue. Acid insoluble residue, frequently referred to as Klason lignin, is considered high molecular weight lignin which is a behavior-based definition. A more detailed structural analysis would require further characterization of the material. Acid insoluble residue must be corrected for ash, as a significant portion of the ash in the whole biomass is acid insoluble. Some herbaceous feedstocks may need to have the acid insoluble residue corrected for protein as well, as a significant portion of the protein from the feedstock can condense into that fraction. The specific amount of protein that will co-condense can vary between feedstocks. Individual feedstocks need to be evaluated for protein condensation into the acid insoluble residue. This evaluation is not included in the method.
Acid soluble lignin is low molecular weight lignin that is solubilized in the acidic hydrolysis solution. Inclusion of acid soluble lignin in the total lignin value is necessary, as acid soluble lignin can represent a significant portion of the lignin. The LAP describes the measurement of acid soluble lignin by UV-Visible spectroscopy, but does not detail the determination of the proper extinction coefficient for feedstocks. A short list of common extinction coefficients is included in the LAP.
This LAP discusses several notable interferences, such as high moisture or ash content in the sample. High moisture content, above 10% by weight, can dilute the acid concentration beyond the tolerances of the LAP, possibly resulting in incomplete hydrolysis. Similarly, ash content above 10% by weight may buffer the acid, causing an effective reduction in acid concentration. However, not all inorganic material in biomass has this buffering effect, so the buffering effect of excessive inorganic material should be determined prior to analysis if this problem is suspected.
Analytical hydrolysis of unextracted biomass feedstock is not recommended. Extractives can deposit on the filter during separation of the acid soluble and acid insoluble fractions, resulting in excessive filtration time. In addition, our experience has clearly shown that the extractives partition irreproducibly between the acid soluble and acid insoluble fractions, compromising the measured lignin values.
8.4.7 Measuring Starch
Starch, a glucose polymer, is often found in biomass feedstocks that contain grain, or in young plants. NREL recommends use of an adapted version of the Megazyme Total Starch Assay (amyloglucosidase/α-amylase method) [25]. The major difference in the NREL adaptation is the use of HPLC detection for quantification of glucose after enzymatic hydrolysis as opposed to color assay. The quantification of glucose is not specific to starch, therefore extraction of the bio- mass is recommended prior to the starch assay to remove any nonstructural free glucose or sucrose. Failure to remove free glucose and sucrose will artificially elevate the apparent starch content of the biomass sample. If this procedure is performed in conjunction with carbohydrate (cellulose and hemicellulose) determination, the contribution of glucose from starch can be used to correct the structural glucan value.
8.4.8 A Typical Analysis
The flow chart of biomass compositional analysis, Figure 8.3, provides an example of a complete biomass feedstock analysis. In this section we step through an analysis of a whole feedstock sample and discuss the typical decisions an analyst will face at each step, using a hypothetical herbaceous feedstock as an example. This hypothetical feedstock is a potential dedicated bioenergy crop that is harvested off of the ground. The plant is known to produce grain late in life, but we were told by the researchers who did the harvesting that this particular sample should not contain grain. Before being shipped to us for analysis the sample was dried and milled through a 2-mm screen and sealed in a plastic bag.
As this sample has already been milled to an appropriate particle size, the first decision to be considered for this sample is whether sieving is necessary. Initial ash measurements indicate an ash content of 12%, which is greater than the recommended 10%, and may interfere with the acid hydrolysis steps.
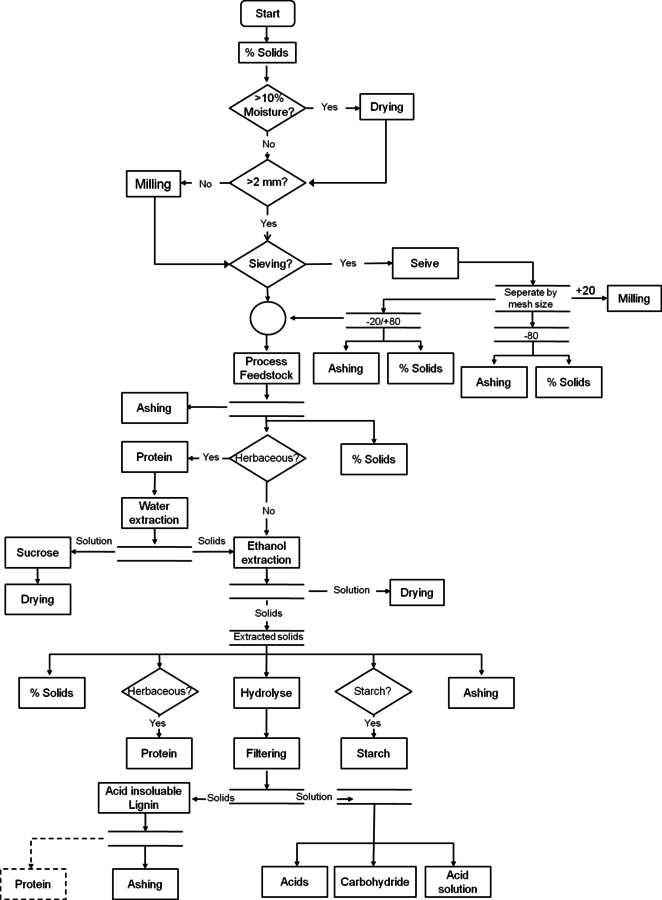
Fig. 8.3: This figure is a flow chart for the analysis of feedstocks using NREL LAPs. The decision making process is outlined to assist the analyst in putting together the individual LAPs in the correct order and achieving summative mass closure.
Sieving could be tested to determine if some of the ash could be partitioned into the fines (-80 mesh), but as the plant was harvested off of the ground, the high ash content is likely soil and can be reduced by water extraction. Since the sample is herbaceous, water extraction is already part of the analysis suite.
Extraction is the next major consideration for the sample. As discussed above, we extract all herbaceous materials with water and ethanol. Prior to extraction with water, samples must have protein and total solids measurements performed, in addition to the ash measurement, which has already been done. Water extraction is required to quantify sucrose levels for herbaceous materials, but it also proves to be efficient at reducing the ash content to 5%. If it had not, sieving would need to be reconsidered to reduce the ash content to less than 10% before hydrolysis. Ethanol extraction follows the water extraction to ensure no complications regarding acid insoluble lignin measurements. The sample is now extractives-free and ready for hydrolysis.
Prior to hydrolysis the sample must again have total solids, protein, and ash measurements performed. Total solids will be used to convert values to a dry weight basis. Protein and ash measurements are used to determine the amount of these constituents removed during the extraction process.
Two-stage acid hydrolysis is performed, but the sample seems to have difficulty filtering while removing the acid insoluble residue. Carbohydrate analysis, acetyl analysis, and acid soluble lignin measurement of the hydrolysate are performed.
Once the data are compiled, the glucan measurement seems unusually high and the mass closure is significantly below 100%. Other constituent values seem to be typical of similar herbaceous feedstocks. Additionally, the acid soluble lignin results seem to have higher than expected variability between replicate analyses. These problems may stem from one issue or a combination of problems. Two potential areas of interference will be examined.
If the plant did contain grain that was not detected in the field, the sample may contain starch that was not accounted for. Since starch present during analytical hydrolysis is measured as glucan in the analysis, the starch content would explain the high glucan values, but not the low mass closure.
The unusually slow filtration of the acid insoluble lignin and the high acid insoluble residue variability are often related. In this case, further solvent extractions would be a good consideration to remove additional fractions of extractable material.
8.5 Summative Compositional Analysis of Pretreated Biomass Slurries and Liquors
Most lignocellulosic feedstocks cannot be directly fermented from a whole feedstock state. Some chemical or physical decomposition of the constituents is necessary to liberate carbohydrates from the plant structure. One common approach is pretreatment. The chemical pretreatment of biomass, followed by saccharification, is a common process in the bioethanol industry [26]. A wide array of pretreatment conditions allows the tuning of components released from the biomass [27]. LAPs developed at NREL have been optimized to provide compositional analysis for biomass feedstocks as well as intermediary products of dilute acid pretreatment.
The LAPs are optimized for woody or herbaceous species that have been pretreated with dilute acid at elevated temperatures. These LAPs have been successfully applied to biomass pretreated with steam or hot water at neutral pH. Biomass pretreated under alkaline conditions may require substantial method adjustment before compositional analysis may be performed. Biomass that has been mildly treated or degraded (i.e., during ensiling) is not suitable for this type of analysis and may be better considered a feedstock for analysis purposes.
Dilute acid pretreatment yields what is termed slurry. Slurry is composed of undigested biomass solids and an aqueous phase. The aqueous phase, or liquor, typically will contain large portions of the xylans, some of the lignin, and any degradation products from the acid pretreatment. The cellulose typically remains in the solid fraction of the slurry along with whatever lignin did not dissolve during pretreatment. Minor constituents, such as ash and protein, are usually split between the two phases.
Discussions of the LAPs necessary to obtain complete compositional analysis of a pretreated biomass slurry sample are included below. Slurries are generally separated into two fractions for analysis. The first is a filtered liquor sample. The second is the solids fraction of the slurry that has been washed to remove any liquor traces and then dried. There are many subtleties in the analytical suite of LAPs, and this summary is not meant to replace a careful reading of the relevant LAPs in any way.
8.5.1 Sample Preparation
One of the only considerations for preparing a pretreated biomass slurry for analysis is representative sampling. Slurries can range in consistency from a thick paste to a highly liquid sample, and may contain chunks of partially digested biomass or condensation products. Pretreated slurries are usually very heterogeneous and sampling can be a major hindrance to analysis. We recommend that the slurry be thoroughly mixed immediately before sampling. Failure to immediately sample after mixing will not change the composition of the washed solids or the liquors, but can significantly bias any attempts to determine fraction allocations, as solid/liquid separation begins immediately. Figure 8.4 demonstrates the separation of liquor and solid in several slurry samples.
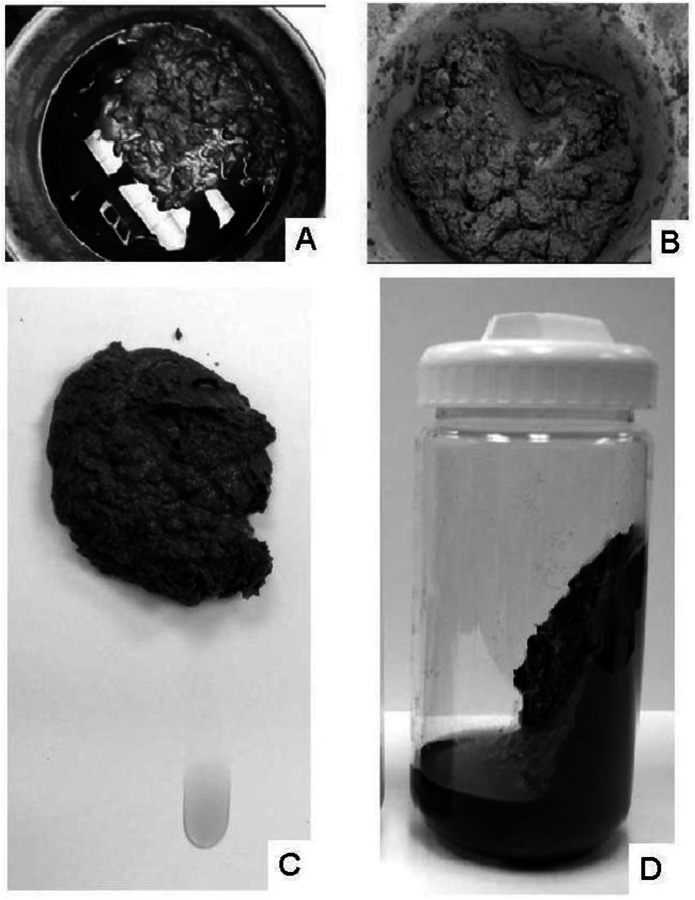
Fig. 8.4: (A) A dilute acid pretreated corn stover slurry in a 55 gallon drum that has been left to settle for several months. A clear separation of the solid and liquid phases is evident. (B) The slurry from photo A, homogenized by mixing. (C) A well-mixed pretreated corn stover slurry left on the benchtop for 30 minutes has already begun to separate. (D) A pretreated corn stover slurry after centrifugation, separating the solid and liquid phases for further analysis.
8.5.2 Measuring Insoluble Solids
Due to the varied components present in the slurry, the solid and liquid phases are separated for parallel analyses. LAP Determination of Insoluble Solids in Pretreated Biomass Material is used to separate these fractions as well as determine the fraction of insoluble solids (fIS) that is present in the pretreated slurry [28]. It describes the detailed measurement of solids and liquids that is necessary to relate measured component concentrations back to the slurry as a whole. The wash water from the rinsing process must be kept if fIS is to be determined. This process may also be used to simply isolate liquor or washed solids samples. In this case, many of the measurements and calculations can be eliminated.
Two methods are detailed for the separation of the liquid and solid fractions, centrifugation and filtration. Both methods separate a sample of liquor from the slurry for analysis, prior to washing of the solids. Both methods detail steps for washing the solids free of soluble materials by repeated rinsing with water. An alternative for the isolation of the liquor from the slurry is pressing with a pneumatic or hydraulic press.
Centrifugation is our recommended method for most biomass samples. A large capacity centrifuge is required to process enough pretreated biomass for subsequent compositional analysis or further experiments (e.g., saccharification and fermentation of the solid material). Care should be taken to retain as much of the fine solids during the washing procedures as is practical, as these materials may have a significantly different chemical makeup.
Filtration can be faster than centrifugation for samples that are lightly pretreated, or samples with an undigested consistency. Care should be taken when using the filtration method to prevent exposure of the liquors to excessive vacuum, as evaporation of the water will cause concentration of the solubilized components in the filtrate. Samples that are more easily washed by filtration often require pneumatic or hydraulic pressing to remove the liquor fraction in a separate step.
Washing of the solids is critical, as the residual liquor present in the solids contains acid that will concentrate as the solids dry, causing chemical degradation of the solids. Additionally, the sugars dissolved in the liquor can significantly bias the measured sugars in the solids. To ensure complete removal of soluble sugars, the concentration of sugars is monitored in the rinses. Xylose liberated from the hemicellulose is the most concentrated sugar in the liquor, but if glucose is easier to monitor it may be substituted, as it is present in the liquor as well.
The procedure detailed above is specifically designed for the isolation of materials for compositional analysis. If samples are to be isolated for saccharification or fermentation, there are additional considerations. Washed pretreated solids should not be dried before saccharification or fermentation, as this can cause cell wall collapse. Cell wall collapse limits the availability of the surfaces to enzyme and fermentation agents.
Unwashed pretreated solids should not be pressed at excessive pressures as this may also lead to cell wall collapse. We have performed tests up to ~600 psig of direct pressure that show no detrimental effect on enzymatic hydrolysis. We recommend further testing be done before exceeding this pressure.
8.5.3 Measuring Liquors
The procedures for detailed analysis of liquor samples can be found in LAP Determination of Sugars, Byproducts, and Degradation Products in Liquid Fraction Process Samples [29]. This LAP covers the analysis of monomeric carbohydrates and carbohydrate degradation products by HPLC, and acid soluble lignin via UV-Vis spectroscopy. It also covers the determination of oligomeric carbohydrates in solution through a single stage acid hydrolysis and subsequent HPLC analysis. It describes the preparation of HPLC standards, HPLC method setup, and the use of sugar recovery standards, which are used to correct for loss of carbohydrates during hydrolysis.
8.5.4 Measuring Washed Solids
The procedure for chemical compositional analysis of washed and dried pretreated solids is very similar to that of an extracted feedstock sample, detailed earlier, in Section 8.4. However, washed pretreated solids do not require extraction, as the extractable material is considered to be removed by the pretreatment and the washing of the slurry. Additionally, chemical changes in the biomass will result in most extraction methods removing more material than anticipated, some of which cannot be characterized. However, the analytical methodology is substantially similar. The differences between the procedures for compositional analysis of extracted feedstock and washed pretreated solids are discussed here. A flow chart of analysis (Figure 8.5) provides an example of a complete slurry analysis. Included are steps for solid/liquid separation and analyses of the fractions.
Milling of feedstock samples is carefully controlled to avoid degradation of small particles during hydrolysis. Washed pretreated solids are much harder to mill to a specific particle size because there is usually significant degradation of the structure of the biomass. It is still necessary to mill the solids, but fines are never removed by sieving. Generally, a smaller particle size is accepted for pretreated material.
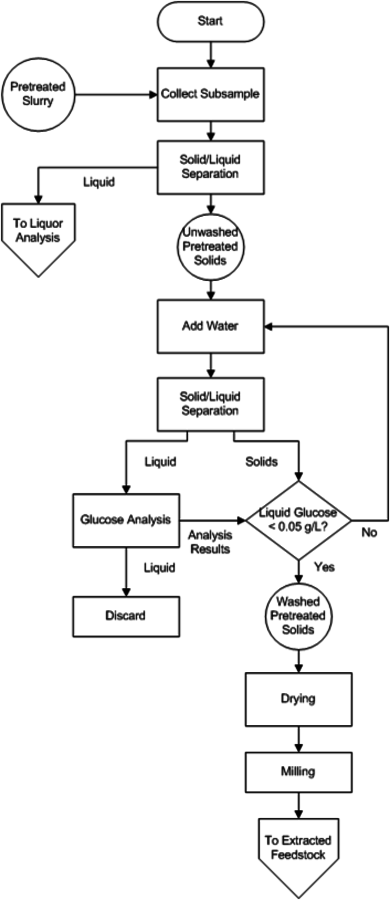
Fig. 8.5: This figure is a flow chart for the analysis of acid pretreated slurries using NREL LAPs. The decision making process is outlined to assist the analyst in putting together the individual LAPs in the correct order and achieving summative mass closure. It includes the separation of the solid and liquid fractions of slurries. The analysis of washed dried solids references the analyst to the extracted feedstock flow chart, as the analyses are identical after that point.
Protein analysis is performed on the washed pretreated solids, but it is difficult to determine a conversion factor for nitrogen to protein due to the degradation of the proteins during acid pretreatment. The protein content is still reported, but it is important to realize that this is best viewed as an estimate.
Extractives remaining in very mildly pretreated feedstocks will interfere with LAP Determination of Structural Carbohydrates and Lignin in Biomass [24]. As with the analysis of feedstocks, extractives can deposit on the filter during separation of the acid soluble and acid insoluble fractions, resulting in excessive filtration time and potential concentration of the liquid fraction. Extractives can also partition irreproducibly between the acid soluble and acid insoluble fractions, compromising the lignin values. We recommend that the extinction coefficient used for the originating feedstock also be used for the pretreated materials when determining the acid soluble lignin content.
8.6 Summative Mass Closure-Calculations, Troubleshooting, and Errors
Performing a comprehensive mass balance across a process, including determining the composition of feedstocks, intermediate materials, and end products, can require dozens of individual measurements and hundreds of calculations. All of the calculations are listed in the appropriate LAP. To minimize the risk of one calculation error spoiling a set of analyses, NREL has developed Excel spreadsheets that automatically calculate all necessary equations on measured data. These spreadsheets are available for download [30]. These sheets also flag samples that do not replicate analyses within specified error tolerances. While these sheets are an invaluable tool for an analyst, it is important to understand the mathematics behind the calculations to better identify analytical problems.
After the data have been compiled, the analyst should closely examine them for problems. While the aim of summative mass closure is to characterize 100% of the constituents, inherent error in measurements usually provides a range of 97–103% mass characterization. Summative values outside of that range require examination. Further, the analyst should always review values to ensure that they are reasonable. Some analytical issues can cause analyte values to shift inversely, making the individual values wrong, but the mass closure appropriate. For example, incomplete hydrolysis can cause carbohydrate values to be low, and the lignin value to be high.
A variety of problems can be identified through data examination. Some problems, such as entering measured values incorrectly, can be quickly spotted and rectified. In the feedstock analysis section above, an example problem including low mass closure, disproportionately high glucan values, acid soluble lignin values with high errors, and unusually slow filtration is presented. This is an excellent example of multiple issues compounding problems.
Other issues that may arise when examining data are: errors in duplicate values, mass closure values out of range, and the presence of oligomers in the carbohydrates. Areas to investigate for each of these problems are presented. The first step in data review should be a careful review of the standards run during the analyses. Generally, a well-characterized material of similar matrix is run concurrently with the samples. This can be an in-house sample, or one purchased externally, for example the biomass reference standards from NIST [10]. An analysis may only be deemed successful if the standard’s values are within acceptable tolerances, as determined by historical values. If these values are outside of acceptable tolerances, the entire run must be examined.
Errors in duplicate values can be due to basic data entry errors or instrument malfunctions. They may also be due to heterogeneous sampling. This is a particular issue with biomass, as sample settling can occur rapidly. If the cause cannot be pinpointed, we recommend that duplicate analyses are performed again.
Mass closure issues, when the mass closure is under 97% or over 103%, can be the result of single or multiple constituents. A high mass closure indicates that one or more constituents have been counted twice during analyses. For example, if the protein value of a feedstock is measured, but condensed protein is not removed from the lignin value, the protein will be counted twice. A low mass closure indicates that constituents have been missed. This is a particular problem with extractives, such as sucrose, which will degrade beyond measurability if not captured at the start of the process.
Problems that may be noticeable during analysis are slow filtration after hydrolysis and the presence of oligomers in the carbohydrate solutions after hydrolysis. Slow filtration is generally caused by the presence of extractives. If one or more groups of extractives (e.g., waxes or fats) are not removed prior to hydrolysis, they can clog the filter and impede filtration. Remaining extractives will frequently manifest as artificially high lignin values.
If oligomers are noted in post hydrolysis carbohydrate chromatograms, incomplete hydrolysis has occurred. Incomplete hydrolysis may be the result of poor technique, autoclave malfunction, or low acid concentration. Many of the noted interferences can result in incomplete hydrolysis, and a careful examination of these interferences should be undertaken with the specific sample matrix in mind.
8.7 Uncertainty in the Primary Measurements
Uncertainty is inherent in every measurement, and it is important to understand sources of uncertainty and quantify them if possible. This is especially true with fiber analysis methods for biomass compositional analysis as they are empirical methods. The final results from compositional analysis are very dependent on how the methods were performed; minor variations in methods can cause significant changes to the results.
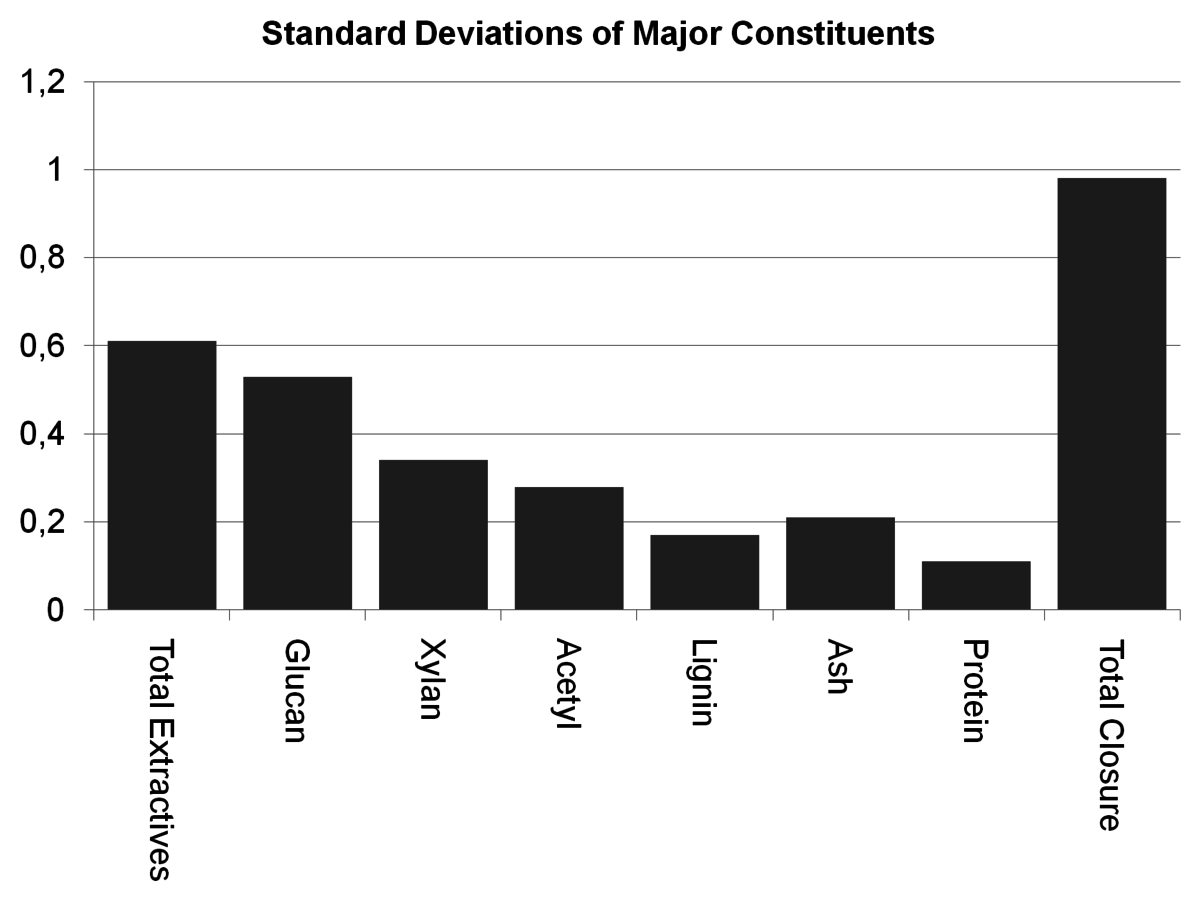
Fig. 8.6: The uncertainties for each constituent measured during the NREL round robin of corn stover indicate that extractives contribute significantly to the uncertainty of the mass closure.
NREL recently published the results of an internal round-robin style determination of the uncertainties associated with the measurement described in the LAPs [31]. Seven different analysts operating in two different laboratories performed a total of 156 replicate analyses on a common corn stover sample. The results of that study are discussed below. It should be noted that the errors discussed here are uncertainty, which is the result of random error inherent in measurements. This is different from a bias, which is the result of a systematic error that causes results to be constantly high or low.
The primary contributor to the uncertainties for total mass closure was extraction, as seen in Figure 8.6. As described in the text above, a large number of the measurements are performed on an extractives-free sample and the con-
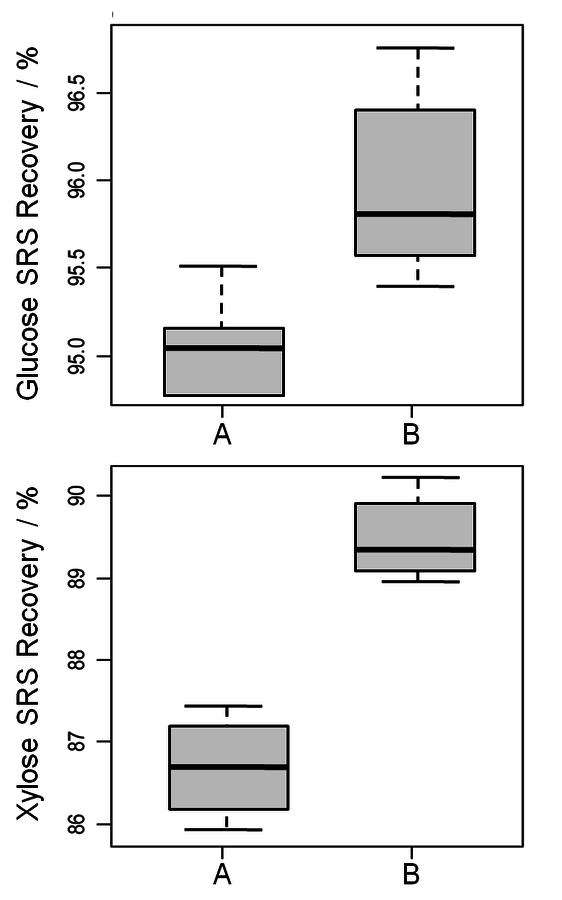
Fig. 8.7: Recoveries of glucose and xylose from SRSs. A and B represent two different autoclaves. Not only can the difference in recovery per autoclave be noted, but the differences in standard deviation demonstrate the disparity in autoclave performance.
stituents are mathematically corrected back to a whole biomass basis. Since that correction is based on the extraction and moisture measurements, extraction has high leverage on a large number of constituents.
Another major contributor to uncertainty was the variability inherent between batches of analyses. Each analyst in the study performed batches that contained 12 corn stover samples and one method control. The variability within each batch was found to be much smaller than the variability between batches. This indicates that the specific conditions during a single analysis cause small but measurable variations in the results of the compositional analysis.
One uncontrollable source of method variation is the heating and cooling profile of the autoclave during the second stage of acid hydrolysis. From one autoclave to another this heating profile is likely to be different. Figure 8.7 shows the compiled variability for two autoclaves used during the round robin. The two autoclaves do not exhibit the same sugar degradation factors. While it is common to use a “historical” factor for sugar degradation, these data clearly indicate that there is a bias between autoclaves and that each autoclave should be evaluated independently. In addition to the bias, each autoclave has a range over which the loss factor varies. This range is likely related to a number of aspects, including autoclave function on a specific day, promptness of the analyst at removing the samples from the autoclave following hydrolysis, and cooling rate of the vessels once removed. These considerations also make it difficult to argue for the use of a “historical” factor. The sugar recovery standards attempt to control for autoclave variability, but in doing so become very high leverage measurements. We recommend that triplicate SRSs be run to mitigate some of the uncertainty in this measurement.
8.8 Propagation of Uncertainty in Primary Measurements
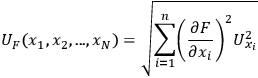
All primary analytical measurements have some amount of uncertainty associated with them, and measurements associated with biomass analysis are no exception. For example, five repeated measurements of the concentration of glucose and xylose in a single pretreated liquor sample using HPLC will not produce exactly the same value. The same is true for any repeated empirical measurement. When multiple primary analytical measurements are combined in a calculation, the individual uncertainties in the primary measurements are propagated in the calculation. We have discussed the uncertainties associated with the biomass compositional analysis methods used at NREL, and now we consider the effect of these uncertainties on calculated values. This is important because the purpose of making primary analytical measurements is almost always to use them in subsequent calculations, and it is important to understand the precision with which we can make claims about these calculated values. Of particular interest is the calculation of component yields from specific unit operations, such as the yield of glucose from saccharification, the yield of ethanol from fermentation, or the yield of xylose from pretreatment.
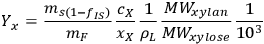
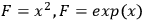
As a specific example of interest to biomass researchers, consider a batch pretreatment reaction where a biomass feedstock is treated with dilute acid to break down the hemicellulose into soluble xylose. It is common to calculate the yield of xylose from this chemical reaction; what fraction of the xylan originally in the biomass feedstock was hydrolyzed to monomeric xylose? The yield of xylose from a batch pretreatment can be written as:
|
8.1 |
where
 is the mass of the pretreated slurry produced in the experiment,
 is the mass of feedstock used, fIS is the fraction insoluble solids in the pretreated slurry,
 is the liquor density (g/mL),
 is the concentration of xylose (monomeric or total) in the liquor (g/L),
 is the mass fraction of xylan in the feedstock, MWxylan is the molecular weight of xylan, MWxylose is the molecular weight of
| Parameter | Value | Units | SD | RSD (%) |
|---|---|---|---|---|
| Fraction insoluble solids fIS | 0.25 | Mass fraction | 0.01 | 4 |
| Liquor xylose concentration cX | 60 | g/1 | 1 | 2.5 |
| Feedstock xylan content | 0.20 | Mass fration | 0.005 | 2.5 |
| Liquor density | 1.11 | g/mL | NA | NA |
| Xylose yield (analytic) | 0.0235 | 3.29 | ||
| Xylose yield (MC, 10000 iterations) | 0.713 | NA | 0.0235 | 3.29 |
Tab. 8.1: Uncertainty propagation in the yield of xylose from biomass feedstock during pretreatment. The analytic and Monte Carlo (MC) approaches to calculating the uncertainty in xylose yield during pretreatment produce essentially identical results. SD = Standard deviation; RSD = Relative standard deviation (SD/Value).
Tab. 8.1: Uncertainty propagation in the yield of xylose from biomass feedstock during pretreatment. The analytic and Monte Carlo (MC) approaches to calculating the uncertainty in xylose yield during pretreatment produce essentially identical results. SD = Standard deviation; RSD = Relative standard deviation (SD/Value).
xylose, and the term 103 is simply for unit conversion (mL to L). For typical values of these parameters (shown in Table 8.1) the yield of xylose is 71.3%; almost three quarters of the xylan originally present in the feedstock is released as xylose in the pretreated liquor.
How can we calculate the uncertainty in the xylose yield from the uncertainty in the primary analytical measurements? There are two general approaches to the propagation of uncertainty. First is a classical approach that uses differential calculus, and second is a Monte Carlo approach that uses uncertainty distributions of the primary measurements to calculate the uncertainty distribution of the calculated value.
Typically, the standard deviation of repeated measurements collected over time is used as a measure of uncertainty. If we can assume that the measurement errors that contribute to the uncertainty are normally distributed, then by using the standard deviation as our measure of uncertainty, we can safely assume that a single measurement will be within 1 standard deviation of the “true” value 69% of the time, and within 1.96 standard deviations 95% of the time.
As an aside, another option for expressing uncertainty is to use a confidence interval. If the standard deviation of n repeated measurements from a given experiment is known (
 ), then the confidence interval can be expressed as

|
8.2 |
where
 is the value of Student’s t-distribution for n measurements. This formulation is useful because repeated independent measurements decrease the value of the confidence interval. However, the measurements must be truly independent and must include all the steps required to make the measurement: sample collection, sample manipulation, and finally measurement. For example, replicate HPLC injections of a corn stover analytical hydrolysate to measure structural carbohydrates would not count as independent measurements of carbohydrate content because all of the steps required to make this measurement were not performed independently (e.g., the extraction of the feedstock, the two-stage analytical hydrolysis, and the filtration prior to HPLC analysis). All steps used to generate and measure the sample must be independently replicated.
The classical uncertainty propagation differential equation can be written as:
|
8.3 |
where
 is the uncertainty in the value of the value F which is calculated analytically from the primary measurements
 through
 . The uncertainty of the calculated value depends on the influence each primary measurement has on the calculated quantity (the
 terms) and the uncertainty of the primary measurement itself (the
 terms). Thus, the uncertainty in a primary measurement can have a large influence on the uncertainty of a calculated value if a small change in the primary measurement causes a large change in the calculated value (e.g.,
 ) or if there is a large uncertainty in the primary measurement itself.
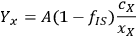
To simplify this example problem, we will assume that the liquor density and the feedstock and slurry mass measurements have negligible uncertainty compared to the other terms, since these quantities (
 ) are typically measured to 3 or 4 significant figures. With this assumption, the uncertainty in the calculated xylose yield depends only on the uncertainty in three primary measurements: the fraction insoluble solids (fIS) of the pretreated biomass slurry, the xylose concentration of the pretreated liquor (
 ), and the xylan content in the solid (
 ). We can rewrite the xylose yield equation as:
|
8.4 |
where the parameter A now groups all the terms not directly associated with the uncertainty. If we apply the uncertainty partial differential equation to the xylose yield equation using the standard deviation s as the measure of uncertainty, this works out to be:
|
8.5 |
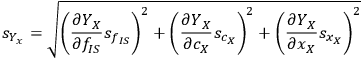
Calculating the partial derivatives and doing some simple algebra gives us:
|
8.6 |
Thus, the expected standard deviation of xylose yield calculation can be expressed as the combination of the uncertainties of the primary measurements. For any given set of primary measurements (cX, xX, fIS) with associated uncertainties (
 ), we can calculate not only the value of the xylose yield standard deviation of
 but also the uncertainty of this calculation
 . Note that applying the uncertainty partial differential equation to the simple summation
 yields the expression
|
8.7 |
which is the familiar sum of squares rule for adding standard deviations.
While these results show that we can calculate a closed-form algebraic approach to calculating uncertainty, for very complex formulas this is not always possible. Monte Carlo techniques provide distributions of expected values of a calculated value xbased on distributions of expected values of the primary measurement variables. These techniques are most useful for calculating the uncertainty of very complex formulas where the calculation of partial derivatives would be unwieldy, such as techno-economic (TE) or life cycle assessment (LCA) models. Nonetheless, it is a useful technique and we will demonstrate it using the same xylose yield equation.
To perform a Monte Carlo uncertainty calculation, we need to assume some type of distribution of expected values for all primary measurements. In this example, we used normal distributions using the same standard deviation values for each of the three primary measurements. We used the open source programming language R1 to do these calculations. We used 10,000 iterations which were calculated in approximately 1 second on a standard desktop computer, but simulations with 100–10,000,000 iterations provided similar results.
Part one of Section 8 shows the R-code used to generate both the algebraic and Monte Carlo estimates of uncertainty, and part two of Section 8 shows the R-code used to generate the plot shown in Figure 8.8, which shows the calculated distributions of the uncertainties of the three primary measurements (
 ) and the distribution of calculated xylose yield values
 . The bars represent histograms of the results of the Monte Carlo calculations with 10,000 iterations, while the smooth curves are normal distributions fitted to the mean and standard deviations of the Monte Carlo calculation results. Table 8.1 shows the parameters used and the calculated parameters.
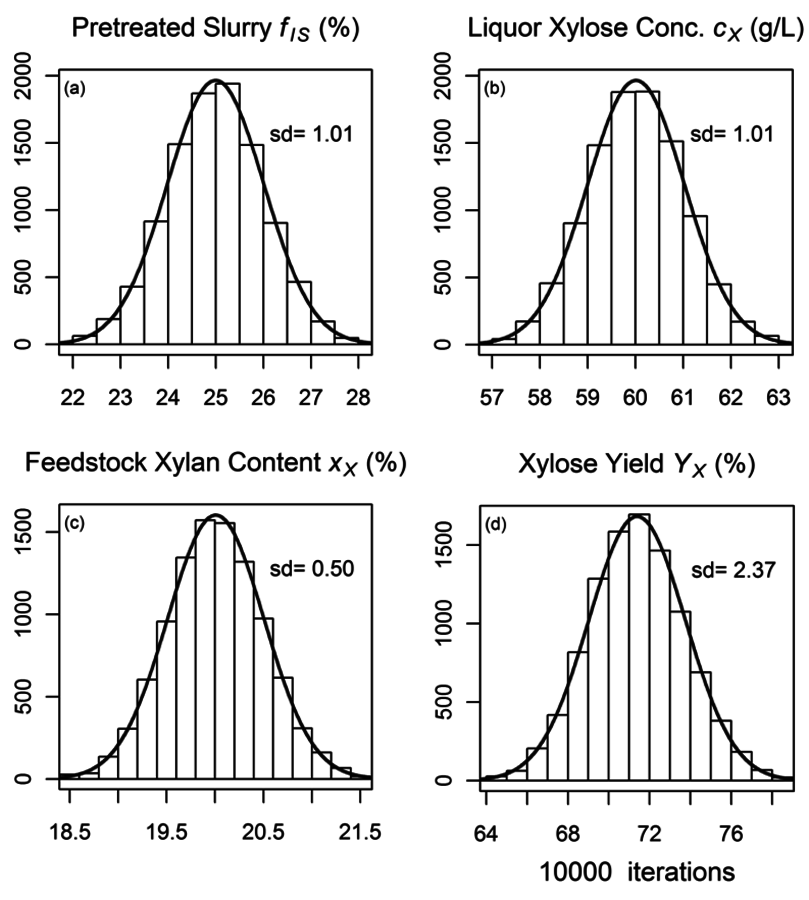
Fig. 8.8: Histograms from Monte Carlo uncertainty calculations. (a) to (c) are primary measurement uncertainties of fraction insoluble solids, xylose liquor concentration, and feedstock xylan content (fIS; cX; xx), and (d) is the uncertainty histogram of the calculated xylose yield (YX): Bars represent histograms of the results of the Monte Carlo calculations, while curves are normal distributions fitted to the mean and standard deviations of the Monte Carlo calculation results.
Both the algebraic and the Monte Carlo methods provide essentially equivalent estimates of uncertainties; about 2.35% of the calculated yield of xylose from xylan, or 3.3% relative standard deviation (RSD). So how can we interpret these results? We can conclude that replicate experiments will provide calculated xylose yield results within +/-1.96*2.35% or 4.6% about 95% of the time. Put another way, two experiments with calculated yield values that differ by less than about 4.6% are not statistically significantly different. Thus, before performing a long series of pretreatment experiments, we can estimate the smallest experimentally-determined yield difference that is statistically significant.
It is interesting that the RSD of the final yield calculation is smaller than the largest relative uncertainty of the primary variables, in this case fIS which has an RSD value of 4%. How can this be? It turns out that the yield calculation actually uses the mass fraction of the liquor and soluble solids (1-fIS) and not fIS. This is an important distinction, because the relative uncertainty in the term 1-fIS is 1.3% (0.01/0.75) not 4.0% (0.01/0.25). As the value of fIS increases, the relative uncertainty in the term 1-fIS increases; at a (nonsensical) value of 0.90 the relative uncertainty is 10%; at 0.95 it is 20%. Again, this surprising result is independent of the technique used to calculate the uncertainty in the xylose yield; both the algebraic and Monte Carlo approaches provide the same results.
The algebraic approach has one advantage over the Monte Carlo approach in that we can use the intermediate calculation results to identify primary measurement variables responsible for the majority of the uncertainty. In the case of our calculation, the liquor xylose concentration uncertainty is responsible for ~60% of the total uncertainty, the xylan feedstock content measurement uncertainty is responsible for ~25%, and the fIS uncertainty for about 15%. Thus, if we wish to decrease the uncertainty associated with the xylose yield calculation, we should begin with decreasing the uncertainty in the liquor xylose concentration measurement.
A rigorous calculation of uncertainty for calculated values is relatively easy to perform using either the partial derivative approach or the Monte Carlo approach; all that is needed is a good understanding of the uncertainties in the primary variables. Such calculations provide a solid understanding of the accuracy of the calculated values, which is important when one is making claims regarding these calculated values.
8.9 Room for Improvement in Biomass Compositional Analysis
While the analysis of biomass is not a new science, it still has many areas that offer opportunity for improvement. Some improvements are in the form of faster analysis time and higher throughput. Others include more accurate characterization of components that are already measured.
Increased throughput, a certain improvement, could be achieved by shortening necessary instrumentation or analyst time. Instrumentation improvements can come in the form of better HPLC column resolution, shorter run times, and increased accuracy. When minutes are shaved off of each instrumentation characterization, time savings can quickly add up. It also may be possible to optimize current methods by altering lengthy hydrolysis steps, concentrating acid, or changing other parameters. Other time consuming steps, like the separation of a slurry into liquor and washed dried solids, would benefit from time reducing steps [32]. Some research has been done in these areas, but new methods must be exhaustively compared to current methods. There is a wealth of historical data generated by current procedures, and it is imperative that the results from new optimized methods be comparable to historical data.
Discovering fast and simple ways to further characterize the components in extractives, especially water extractives, could again offer the added benefit of upgraded co-products. Currently, the detailed examination of the water extractives fraction of biomass is lengthy [23], and not conducive to adoption into a traditional biomass analysis.
More accurately characterizing certain constituents offers a large area for improvement. For example, the lignin content of a feedstock may be used as a fuel source via combustion, or may be upgraded to valuable co-products. More accurate analysis of the lignin content would allow for better decisions on the fate of lignin. Since lignin is a complex structure, and unique to each biomass type, specific characterization of the lignin can be difficult.
The SRSs introduce a high leverage measurement, meaning that this measurement affects all of the carbohydrate measurements, and this measurement has been subjected to recent reexamination. It is necessary to include SRSs with each sample set to correct for sugars lost during the hydrolysis of oligomeric sugars to monomeric sugars. Due to the difficulty of obtaining representative oligomeric sugars to use as SRS standards, monomeric sugars are used. However, monomeric sugars are not a truly representative standard. If high purity representative oligomeric sugars were readily available, this measurement could be improved and lead to greater certainty of sugar concentrations. Figure 8.9 clearly demonstrates the differences between true liquor samples and synthetic liquors, which is as close as we can get with readily available commercial compounds.
Alternatively, the sugar loss could be measured by direct measurement of the degradation products of all sugars in the sample solution. This technique would account for any matrix effects and oligomer behavior. For this to become a reality, a reliable method for measurement of all degradation products would need to be developed. Current methods are limited by an inability to differentiate beyond products derived from C5 sugars or C6 sugars. In biomass types with multiple sugars of the same carbon length, this can lead to overcorrection of one sugar and undercorrection of others.
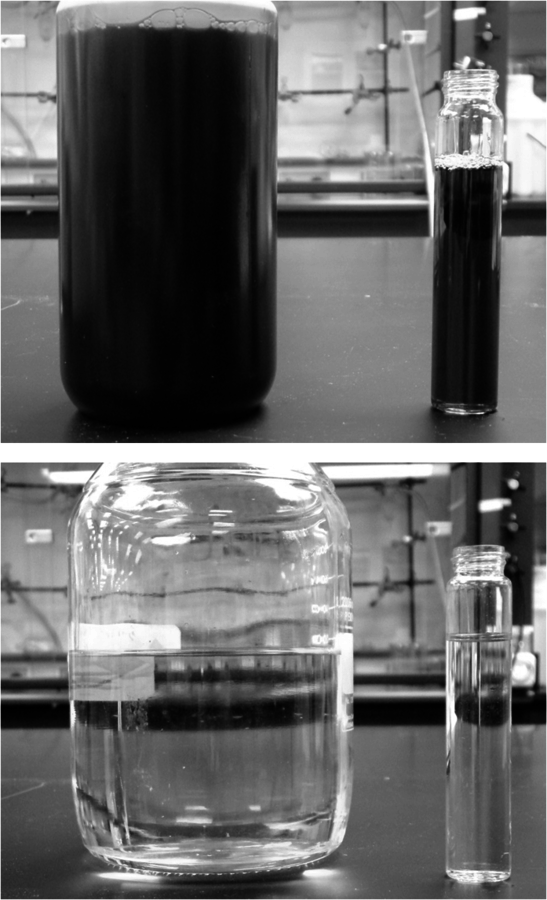
Fig. 8.9: A hydrolysate liquor sample isolated from a pretreated corn stover slurry, top photo, has a dark brown color and is opaque. By comparison, a synthetic hydrolysate prepared to similar concentrations, lower photo, has a much lighter and less opaque appearance. The darker color in a real hydrolysate liquor sample is due to constituents not included in the synthetic, as well as matrix effects that are impossible to account for.
8.10 Rapid Biomass Analysis via NIR
Full chemical characterization of a biomass sample can take weeks, which is both cost- and time-prohibitive in industrial processes. Using near infrared (NIR) spectroscopy coupled with chemometric modeling software can make composition analysis faster and non-destructive. NIR can be applied to solids, liquids, and slurries. It can also be adapted to bulk samples in an on-line environment. Rapid biomass characterization can be utilized in the field to manage crop conditions, at the destination to determine a purchase price based on constituent value and blend feedstocks, and during conversion processes to monitor intermediates and end products. NIR calibration methods are widely used to characterize food, animal feed, and an assortment of agricultural products [33].
In order to develop a working NIR predictive model, much work must be done to characterize an appropriate calibration set. An ideal calibration set should contain samples with constituent values that are evenly distributed across the range of expectation for each constituent. That is, the calibration set should span constituent values expected for future samples. Some minor constituents may not contain enough variability to produce robust models. The uncertainties associated with the wet chemical methods used will translate directly to the NIR predictive method, so care should be taken to minimize chemical analysis uncertainties.
When building a predictive model, mathematically altering the data, also called pretreating or preprocessing, prior to modeling can minimize certain problems. Pretreating can remove much of the spectroscopic noise due to particle size differences and scatter, as well as highlight important peaks and information. A variety of pretreatment techniques is available that correct different spectroscopic issues [34].
Once data are sufficiently pretreated, Partial Least Square (PLS) models can be created to regress the spectroscopic data against the wet chemical information. PLS-1 or PLS-2 models can be used, depending on the data set and desired end models. The PLS-1 algorithm regresses the spectral data against the constituent data one constituent at a time, while the PLS-2 algorithm regresses all constituents simultaneously [35].
All predictive models must be validated. Several statistical validations are used to determine model performance. The root mean square error of prediction (RMSEP), root mean square error of calibration (RMSEC), and correlation coefficient (
 ), provide a good estimator of future model performance. Cross validation is a commonly used method for validation. It is the process of removing a single sample or a group of samples from the calibration set and recreating the model to predict the removed samples. It is a conservative estimator of final model performance. Cross validation provides RMSEP. Predicting the calibration set on the final model provides RMSEC and
 . Deviations from the perfect target line should approximate wet chemical uncertainties. Independent blind validation samples are the best gauge of model accuracy, and should be used as a final check. Models should also be periodically validated with independent samples to ensure continuing accuracy and performance.
Once NIR predictive models have been built and validated, they can be used to predict new samples. Models can only be used to predict samples of a similar matrix and are therefore usually specific to a feedstock or pretreated biomass intermediate type. Models, being mathematical equations, will predict any data input. It is up to the operator to determine the appropriateness of the model, and to monitor the model uncertainties. Samples that do not belong to the calibration population (e.g., different species or samples with constituent values outside of the population range) should not be predicted. This represents the difference between interpolation and extrapolation. As the models are multi-dimensional, linearity is not ensured beyond the calibration range. It is imperative to remember that the user is responsible for assessing the uncertainties associated with the predictions and determining if the sample is a good fit in the calibration population. We also cannot stress enough that the predictions will only be as good as the original data used to create the calibration set. Secondary methods are only as good as the primary methods used to create them.
8.11 Conclusions
The accurate determination of the composition of lignocellulosic feedstocks and process intermediates is an often understated challenge. The individual operations in the methods, such as filtration and weighing, are not difficult to perform. The understanding of the intricacies of the methods and the proper sequencing of the different methods are where the challenge lies. Here we have tried to relate some of the experiences that we have had with a variety of feedstock and pretreatment types.
We have also tried to stress the empirical nature of the methods. What may seem to be a minor change to a procedure can lead to a bias between data sets. If a direct comparison of data is necessary, undetected biases could lead to misinterpretation of results. Our colleagues in the field have published alternate methods that have both advantages and disadvantages as compared to the methods we present here. Those methods are also highly empirical. Therefore, it is important to know and understand the methods used to generate any data and the characteristics of the data they produce. Again, an undetected bias could make a true comparison impossible.
Finally, we recognize that there is room to improve the techniques for determining the composition of biomass. It is our hope that the reader will be inspired to contribute to the development of these future methods. Improvements of methods for the chemical characterization and rapid analysis of feedstock and process intermediates will play important roles in the biorefineries of tomorrow. As one esteemed colleague once said: “You cannot control what you cannot measure.”
Acknowledgments
Sections 4–6 are based on two recent NREL technical publications: the Summative Mass Closure LAPs [12,13] provide an overview of the individual LAPs, detail how the individual LAPs integrate, as well as highlight many of the pitfalls that can cause an analysis to fail. Summative Mass Closure LAPs are available for the analysis of lignocellulosic feedstocks and acid pretreated intermediates for fuel production.
Figure 8.4: photos A and B taken by students from the David Koch School of Chemical Engineering Practice at MIT, C and D taken by Justin Sluiter and Courtney Payne, NREL. Figure 8.9: photos taken by Justin Sluiter, NREL.
We acknowledge students from the David Koch School of Chemical Engineering Practice at MIT for their work investigating the effect of uncertainty in primary measurements on yield calculations. This work will be published in the near future.
We appreciate the review of this chapter by Ms. Courtney Payne, Mr. Chris Scarlata, and Dr. Angela Ziebell.
Bibliography
[1] E.D. Larson. A review of life-cycle analysis studies on liquid biofuel systems for the transport sector Energy for Sustainable Development 10(2): 109-126 (2006): 109-126.
[2] C. Somerville, S. Bauer, S. B., Brininstool S., B. S., G. Brininstool, G. B., Facette G., F. G., M. Facette. Toward a Systems Approach to Understanding Plant Cell Walls Science 306: 2206-2211 (2004): 2206-2211.
[3] EERE. Feedstock Composition Glossary. .
[4] B.R. Hames. Biomass Compositional Analysis for Energy Applications. In: Biofuels Ed. by Jonathan R. Mielenz., 2009. .
[5] EERE. Theoretical Ethanol Yield Calculator. .
[6]
[7] E. Wolfrum, A. Lorenz, A. L.. Correlating detergent fiber analysis and dietary fiber analysis data for corn stover collected by NIRS Cellulose 16(4): 577-585 (2009): 577-585.
[8] T.A. Milne, H.L. Chum, H. C., Agblevor H.L.. Standardized analytical methods Biomass and Bioenergy 2(1-6): 341-366 (1992): 341-366.
[9] D.W. Templeton, Sharpless J.H.Yen, S. J.. Compositional Analysis of Biomass Reference Materials: Results from an Interlaboratory Study. .
[10] NIST. NIST Standard Reference Materials. .
[11] J.B. Sluiter, R.O. Ruiz, R. R., Scarlata R.O., S. R.. Compositional Analysis of Lignocellulosic Feedstocks. 1. Review and Description of Methods Journal of Agricultural and Food Chemistry 58(16): 9043-9053 (2010): 9043-9053.
[12] J. Sluiter, A. Sluiter. Summative Mass Closure, Laboratory Analytical Procedure (LAP) Review and Integration: Feedstocks. .
[13] J. Sluiter, A. Sluiter. Summative Mass Closure, Laboratory Analytical Procedure (LAP) Review and Integration: Pretreated Slurries. .
[14] B. Hames, R. Ruiz, R. R., Scarlata R., S. R., C. Scarlata. Preparation of Samples for Compositional Analysis Laboratory Analytical Procedure (LAP). .
[15] H. L. Chum, D.K. Johnson, D. J., Agblevor D.K., A. D., F.A. Agblevor, F. A.. Status of the IEA Voluntary Standards Activity - Round Robins on Whole Wood and Lignins. .
[16] F. Agblevor, H.L. Chum, H. C.. Compositional Analysis of NIST Biomass Standards from the IEA Feedstock Round Robins. In: Energy from Biomass and Wastes XVI Ed. by D.L. Klass. Orlando, FL: Institite of Gas Technology, 1992. 395-421.
[17] A. Sluiter, B. Hames, B. H., Hyman B., H. B., D. Hyman, D. H., Payne D., P. D.. Determination of Total Solids in Biomass and Total Dissolved Solids in Liquid Process Samples Laboratory Analytical Procedure (LAP). .
[18] A. Sluiter, B. Hames, B. H., Ruiz B., R. B., R. Ruiz. Determination of Ash in Biomass Laboratory Analytical Procedure (LAP). .
[19] B. Hames, C. Scarlata, C. S.. Determination of Protein Content in Biomass Laboratory Analytical Procedure (LAP). .
[20] G. Lindstedt. Constituents of Pine Heartwood Acta Chemica Scandinavica 3: 1375-1380 (1949): 1375-1380.
[21] A. Sluiter, R. Ruiz, R. R., Scarlata R., S. R.. Determination of Extractives in Biomass Laboratory Analytical Procedure (LAP). .
[22] TAPPI. TAPPI 264 cm-07 Preparation of Wood for Chemical Analysis. .
[23] S.-F. Chen, R.A. Mowery, R. M., Scarlata R.A.. Compositional Analysis of Water-Soluble Materials in Corn Stover Journal of Agricultural and Food Chemistry 55(15): 5912-5918 (2007): 5912-5918.
[24] A. Sluiter, B. Hames, B. H., Ruiz B., R. B., R. Ruiz, R. R.. Determination of Structural Carbohydrates and Lignin in Biomass Laboratory Analytical Procedure (LAP). .
[25] Megazyme. Total Starch Assay Procedure (Amyloglucosidase/ a-Amylase Method). .
[26] A. Aden, M. Ruth, M. R.. Lignocellulosic Biomass to Ethanol Process Design and Economics Utilizing co-current Dilute Acid Prehydrolysis and Enzymatic Hydrolysis for Corn Stover: National Renewable Energy Laboratory. Golden, CO: National Renewable Energy Laboratory, 2002
[27] C.E. McMillan () Processes for Pretreating Lignocellulosic Biomass: A Review.
[28] A. Sluiter, D. Hyman, D. H., Payne D.. Determination of Insoluble Solids in Pretreated Biomass Material Laboratory Analytical Procedure (LAP). .
[29] A. Sluiter, B. Hames, B. H., Ruiz B., R. B., R. Ruiz. Determination of Sugars, Byproducts, and Degradation Products in Liquid Fraction Process Samples Laboratory Analytical Procedure (LAP). .
[30]
[31] D.W. Templeton, C.J. Scarlata, C. S., Sluiter C.J.. Compositional Analysis of Lignocellulosic Feedstocks. 2: Method Uncertainties Journal of Agricultural and Food Chemistry 58: 9054-9062 (2010): 9054-9062.
[32] N. Weiss, J. Stickel, J. S., Wolfe J.. A Simplified Method for the Measurement of Insoluble Solids in Pretreated Biomass Slurries Applied Biochemistry and Biotechnology 162(4): 975-987 (2010): 975-987.
[33] B. Hames, S. Thomas, S. T., Sluiter S., S. S.. Rapid biomass analysis Applied Biochemistry and Biotechnology 105(1): 5-16 (2003): 5-16.
[34] C.A. Roberts, J. Workman Jr., J.W. J.. Near-Infrared Spectroscopy in Agriculture. Madison, WI: American Society of Agronomy, Inc., Crop Science Society of America, Inc., Soil Sience Society of America, Inc., 2004
[35] E. Wolfrum, A. Sluiter. Improved multivariate calibration models for corn stover feedstock and dilute-acid pretreated corn stover Cellulose 16(4): 567-576 (2009): 567-576.
Appendix
R-code used to calculate the uncertainties in xylose yield calculations using both the analytic and Monte Carlo methods:
The yield of xylose from pretreatment is defined as follows
FIS = fraction insoluble solids
c = xylose concentration in liquor
x = xylan fraction in solid
y<-function(FIS,c,x,A)A*(1-FIS)*c/x/1000
number of iterations for monte-carlo simulation
vary this parameter to see effect on symmetry of distribution
num <-10000
set the mean and SD for FIS, c, and x
FIS mean value & standard deviation
FIS_mean <-0.25 no units
FIS_sd <-0.01
xylose liquor concentration mean value & standard deviation
c_mean <-60 g/L
c_sd <-01
xylan feedstock mass fraction mean value & standard deviation
x_mean <-0.200 no units
x_sd <-0.005
typical liquor density & xylan/xylose MWs
A <-1/1.11 * 132/150 units of g/mL
typical slurries are about 25% solids, so 500 g of feedstock yields 2000 g of slurry
A <- A * 2000/500
create arrays of normally-distributed random variables
FIS <-rnorm(num,FIS_mean,FIS_sd)
c <-rnorm(num,c_mean,c_sd)
x <-rnorm(num,x_mean,x_sd)
create an array of xylose yield values
yy <-y(FIS,c,x,A)
sd_yy <-sd(yy)
asdf <-y(FIS_mean,c_mean,x_mean,A)
use the PDE for uncertainty to calculate sdYY
compare sdYY to sd(yy) above
a1<- -A/1000*c_mean/x_mean*FIS_sd
a2<- A/1000*(1-FIS_mean)/x_mean*c_sd
a3<- -A/1000*(1-FIS_mean)*c_mean/x_mean*x_sd
sdYY<- sqrt(a1+a2+a3)
R-code used to produce the plots in Figure 8.8:
layout(matrix(c(1,2,3,4), 2, 2, byrow = TRUE))
par(mar=c(4,4,3,2)+.1)
FIS<-100*FIS convert to percent
h1<-hist(FIS,plot=FALSE)
xfit<-seq(min(FIS),max(FIS),length=400)
yfit<-dnorm(xfit,mean=mean(FIS),sd=sd(FIS))
yfit <- yfit*diff(h1$mids[1:2])*length(FIS)
plot(xfit, yfit, col="blue", lwd=2,type="l",main=expression(paste("Pretreated
Slurry ",italic(f[IS])," (%)")),xlim=c(mean(FIS)-
3*sd(FIS),mean(FIS)+3*sd(FIS)),xlab="",ylab="")
text(mean(FIS)+2*sd(FIS),max(yfit)*.8,paste("sd=",format(sd(FIS),digits=2,
nsmall=2)))
mtext(" (a)",3,cex=0.66,adj=0,line=-1)
lines(h1)
h2<-hist(c,plot=FALSE)
xfit<-seq(min(c),max(c),length=400)
yfit<-dnorm(xfit,mean=mean(c),sd=sd(c))
yfit <- yfit*diff(h2$mids[1:2])*length(c)
plot(xfit, yfit, col="blue", lwd=2,type="l",main=expression(paste("Liquor
Xylose Conc. ",italic(c[X])," (g/L)")),xlim=c(mean(c)-
3*sd(c),mean(c)+3*sd(c)), xlab="",ylab="")
text(mean(c)+2*sd(c),max(yfit)*.8,paste("sd=",format(sd(c),digits=2,nsmall=2)))
mtext(" (b)",3,cex=0.66,adj=0,line=-1)
lines(h2)
x<-100*x convert to percent
h3<-hist(x,plot=FALSE)
xfit<-seq(min(x),max(x),length=400)
yfit<-dnorm(xfit,mean=mean(x),sd=sd(x))
yfit <- yfit*diff(h3$mids[1:2])*length(x)
xfit<-xfit
plot(xfit, yfit, col="blue", lwd=2,type="l",main=expression(paste("Feedstock
Xylan Content ",italic(x[X])," (%)")),xlim=c(mean(x)-
3*sd(x),mean(x)+3*sd(x)),xlab="",ylab="")
text(mean(x)+2*sd(x),max(yfit)*.8,paste("sd=",format(sd(x),digits=2,nsmall=2)))
mtext(" (c)",3,cex=0.66,adj=0,line=-1)
lines(h3)
yy<-100*yy convert to percent
h4<-hist(yy,plot=FALSE)
xfit<-seq(min(yy),max(yy),length=400)
yfit<-dnorm(xfit,mean=mean(yy),sd=sd(yy))
yfit <- yfit*diff(h4$mids[1:2])*length(yy)
plot(xfit, yfit, col="blue", lwd=2,type="l", main=expression(paste("Xylose
Yield ", italic(Y[X])," (%)")),xlim=c(mean(yy)-
3*sd(yy),mean(yy)+3*sd(yy)),xlab="",ylab="")
text(mean(yy)+2*sd(yy),max(yfit)*.8,paste("sd=",format(sd(yy),digits=2,
nsmall=2)))
mtext(" (d)",3,cex=0.66,adj=0,line=-1)
lines(h4)
mtext(paste(format(num,scientific=FALSE)," iterations"),side=1,outer=F,
line=2.5)
if(to.print) dev.off()