3.1 Introduction
Concerns about declining reserves of petroleum resources in the face of increasing demand, and the political and environmental costs of petroleum have led to increased interest in fuels and chemicals derived from renewable sources. Biorenewable chemicals, or chemicals derived from biomass, are seen to be promising economically and in addition their production can potentially create markets for agricultural commodities, reduce reliance on imported resources, and mitigate the impacts of fossil resource use on climate and the environment. Relative to bioenergy and biofuels, biorenewable chemicals are seen to be a more economically and environmentally advantageous way to use limited biomass resources [1,2]
Although there have been a few notable commercial successes, most biorenewable chemicals today exist only in development laboratories and business plans. The combination of keen business and governmental interest with very limited commercial-scale production data has led to significant uncertainty and vigorous debate about the preferred technology pathways for future biorenewable chemical production and their likely economic and environmental impacts [5-8]
Assessing the economic viability and environmental impact of biorenewable chemicals that are in the early stages of development can be very difficult due to the lack of process data [11]
In recent years, LCA has been recognized as a useful decision-making framework for reducing the environmental impacts of technology. The essence of LCA is the identification and evaluation of relevant environmental implications of a product, process, or system across its entire life span—from creation to disposal as waste or recovery for re-use. By considering the entire life cycle, LCA can avoid “problem shifting” between life cycle stages and receptors. Although LCA techniques are still evolving, LCA has been used to guide public and private sector decisions for several decades [12,13]
Life cycle assessment has been used to assess the few commercial or near-commercial biorenewable chemicals, such as poly-lactide (PLA), 1,3-propanediol (PDO), polyhydroxyalkanoates (PHA), and bio-polyethylene [19-22]
This chapter continues with an overview of the LCA methodology, followed by ways that LCA can be adapted to make it more useful for screening biorenewable chemicals prior to their full development and commercialization. The chapter proceeds with an examination of influences of resource sufficiency and market fluctuations on the early assessment of biorenewable chemical candidate products, and concludes with final thoughts about assessing biorenewable products during early development.
3.2 Life Cycle Assessment Methodology
The standard procedure for LCA is outlined in ISO 14040:2006 and ISO 14044:
2006 which describe the application LCA and define the key stages of analysis as shown in Figure 3.1. The key stages are: setting the goal and scope; creating an inventory of all life cycle uses of resources and environmental interventions (e.g., emissions to air and water); and assessing the impacts. Although the ISO standards are very detailed, the standards also make clear that there is no single method for conducting an LCA. Organizations have the flexibility to implement LCA as established in the standard in accordance with the goal of the study and the requirements of the entity undertaking the study. However, the goal of an LCA shall be clearly defined and unambiguously state the intended application, the reason for the study and the intended audience of the study.
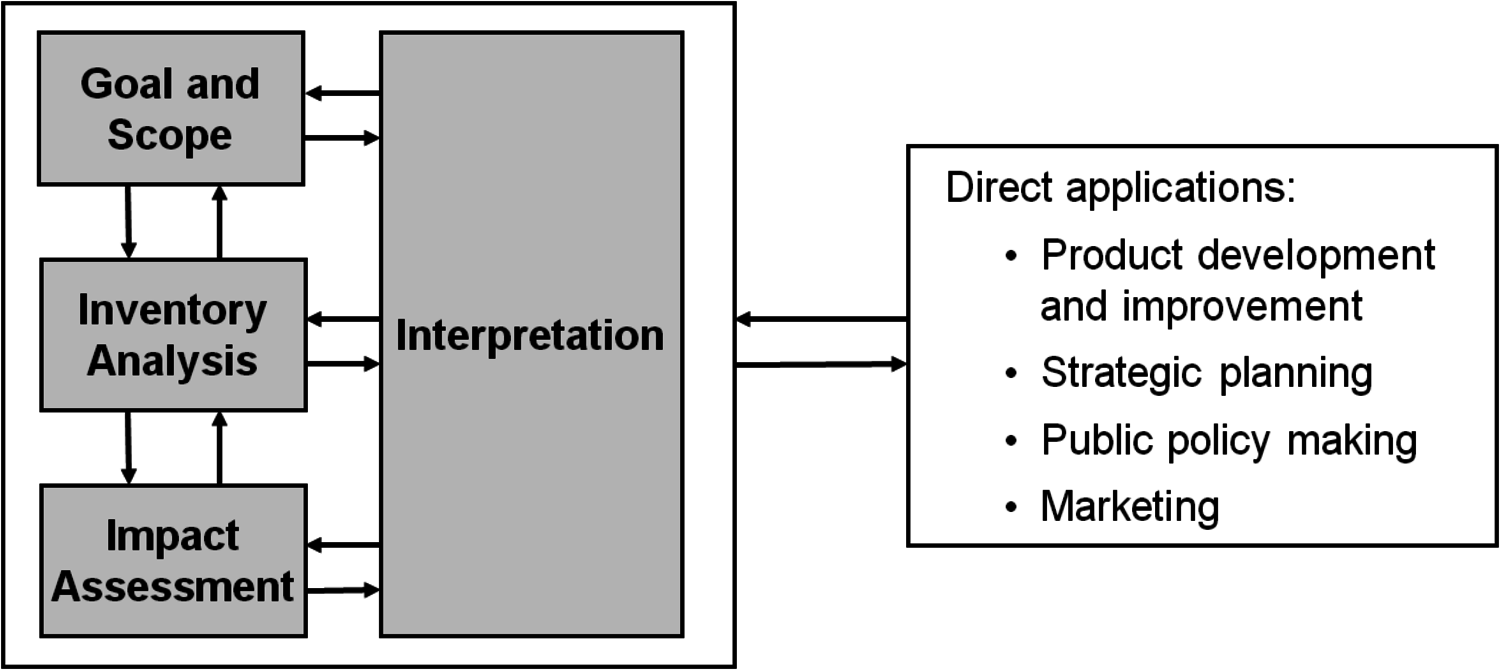
Fig. 3.1: Stages of Life Cycle Assessment (ISO 14040:2006)
The motivations for an LCA study are many and could be to compare process alternatives, identify pollution prevention opportunities, identify resource conservation opportunities or develop a recycling plan. The LCA methodology was developed to inform decisions about improving existing products and processes, and thus relies on an inventory of resource flows into and waste flows out of the system under study. Products and processes that are still under development, or are only conceptual, are difficult to assess, because there are no physical flows to observe and the inventory must be inferred using past experience, engineering judgment and models. This introduces uncertainty in the inventoried flows and the type of interventions that are included in the inventory.
An LCA can be performed for an in-house audience, such as managers, engineers or purchasing agents for the company contracting the LCA; or, for an outside company such as suppliers, customers or regulators. The depth of detail and time frame of an LCA may vary to a large extent, depending on the goal and scope of the LCA. However, the ISO 14040 standard has specific guidelines depending on the purpose of the LCA. Specific and more restrictive requirements are placed on LCAs that are to be used in comparative assertions intended for disclosure to the public. That is, LCAs that analyze two or more product systems, inviting comparisons and judgments.
At the heart of LCA is the idea of a functional unit. The “function” is what is to be accomplished by the product, process, or service under study. The functional unit defines the magnitude of service, the duration of service and the expected level of quality of the service provided by the product under study. For example, holding a specific quantity and type of liquid is the function of a drink container. The functional unit in this case encompasses the service of containing a specific amount of liquid, the time over which the service is to be provided, the degree of sterility that can be achieved, and other services such as labeling space on the bottle. The container could be a plastic bottle, a glass bottle, or a multi-layer aseptic carton.
When making comparisons between different products that have the same use, it is critical to have a consistent framework for keeping track of flows of material, energy and waste. The functional unit is the focus of LCA framework that provides this consistency and also differentiates LCA and other analysis methods such as environmental impact assessment and risk assessment. In the case of a shopping bag used to carry groceries from a store, while paper and plastic bags have the same volume, fewer groceries are generally placed in plastic bags then in paper bags. Practices vary from place to place, but the number of plastic bags needed to hold the volume of groceries usually held by a paper bag range from 1.2–3 [24]
LCA goal and scope definition also requires the identification of the reference flow associated with the functional unit. The reference flow is the set of flows associated with the functional unit and defines all other flows in the product system. Other steps in setting goal and scope include definition of the initial system boundaries, criteria for inclusion of inputs and outputs, impact assessment methodology and data quality requirements. The selection of inputs and modeling of the system shall be consistent with the goal of the study; and the system should be modeled in such a manner that inputs and outputs at the system boundaries are elementary flows. In practice, inputs and outputs are defined by a cut-off rule, based on a factor such as mass, energy or environmental impact. A mass-based cut-off rule, for example, would eliminate from the inventory a material contributing less than a specified percentage of mass input to the product under study.
Assessing and documenting the quality of data are important to the integrity of the LCA. Data quality is described on the bases of data age, geographical coverage, source, collection method, technology coverage, precision, uncertainty, completeness and representativeness [26]
3.3 Life Cycle Inventory
The life cycle inventory (LCI) process entails estimating and recording the resource use, environmental flows, products and intermediate materials for all unit processes within the boundaries of the product system. Figure 3.2 depicts the cradle-to-grave product system. Each stage of the product system contains a set of unit processes, each of which will have input and output flows from the environment in the form of materials, energy and wastes as well as intermediate flows of products among other unit processes.
A principal complication of the LCI is that few industrial processes yield a single output. Most processes yield multiple products or recycle back intermediate and discarded products for use as feed streams. For example, commercial fermentation processes often capture carbon dioxide as a product along with the fermentation product. Waste-to-energy plants provide a service of managing waste but also produce electricity and sometimes heat. Such processes are referred to as multi-functional and their multiple products are called “co-products.” A complication arises when the product system under study uses only one of the “co-products,” but the inventory data represent the full multi-functional process. Under such circumstances the objective is to separate the process into a series of mono-functional processes so that the inventory data can be distributed or “allocated” among the co-products.
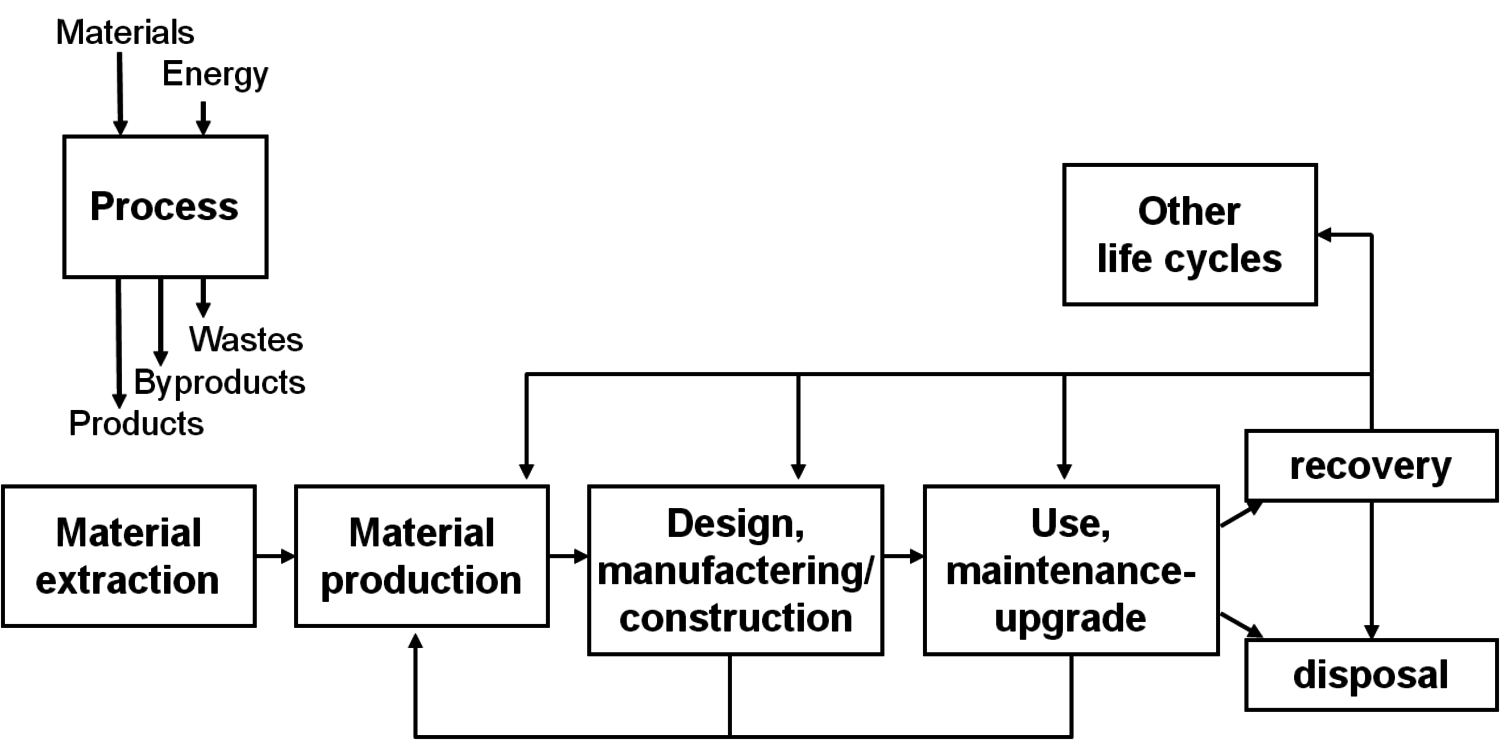
Fig. 3.2: The cradle-to-grave product system includes recovery and recycling back into the original system or into other product systems (other life cycles). Recycled and recovered materials are co-products of the system, and thus result in a multi-functional process that often requires allocation of inventory flows among the products.
Biorenewable processing systems are usually multi-functional processes. For example, as shown in Figure 3.3, the corn dry-grind ethanol process with grain produces ethanol from the starch fraction of the corn grain, but also valuable products from the non-starch grain fraction, along with byproducts of the fermentation process in the form of distillers' solubles, carbon dioxide, and distillers' dry grains with solubles (DDGS) or alternately distillers' dry grains (DDG) or distillers' wet grains (DWG). Although ethanol is the principal product, there are several captured product streams. The DDGS stream is used as a protein-rich animal feed and the revenues it provides to the ethanol operation are essential to the economic viability of the process. The way in which these co-product streams are handled in analysis is one of the most significant differences among LCAs of corn grain ethanol [28]
There are several ways to address the problem of multifunctional processes. The ISO standards [14]
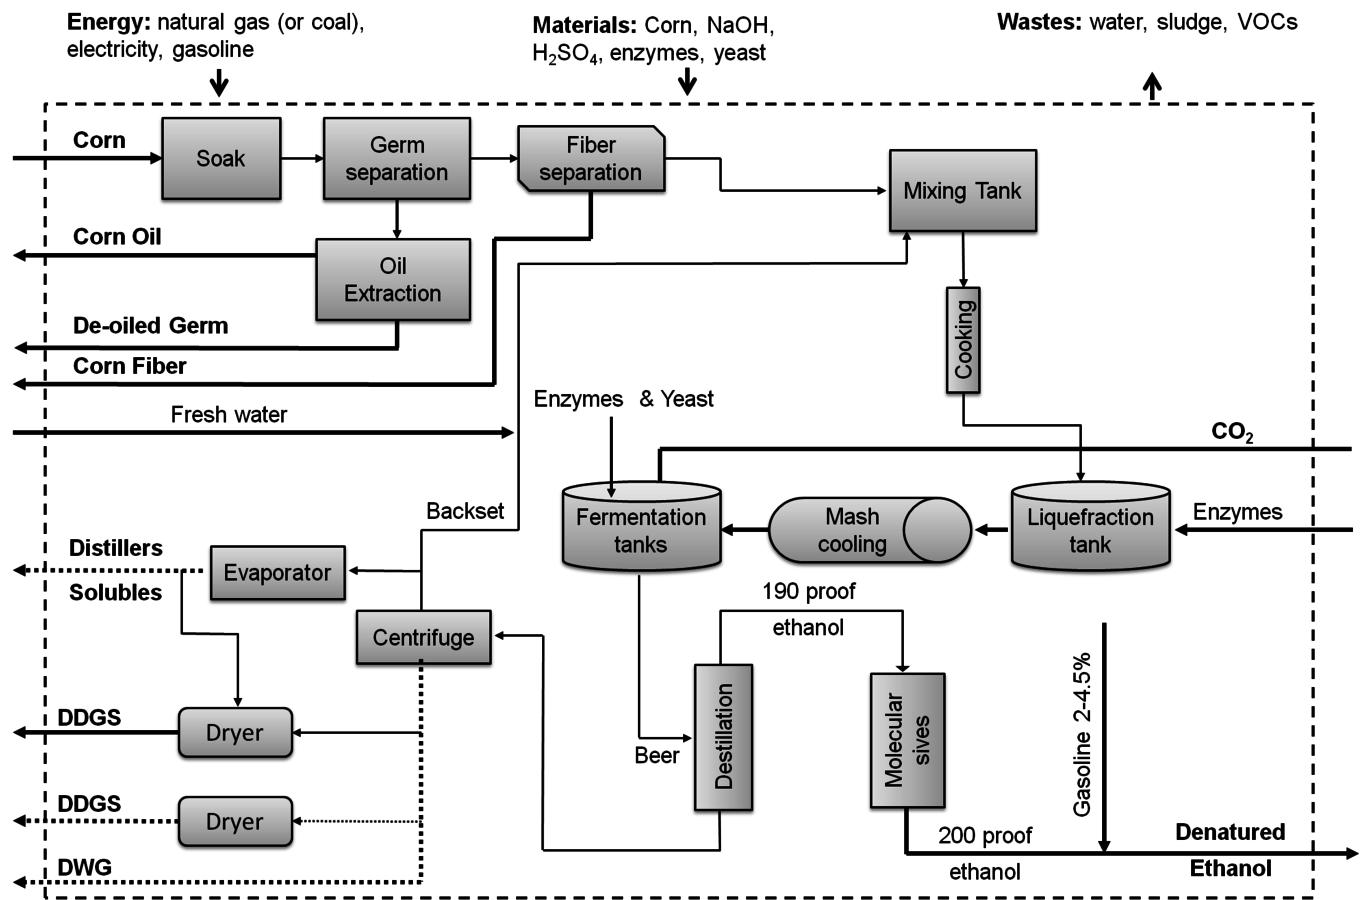
Fig. 3.3: The corn ethanol dry-grind process with fractionation produces multiple valuable products.
3.4 Impact Assessment
The last of the major stages of LCA is Life Cycle Impact Assessment (LCIA). The LCIA is carried out in a two-step process:
1Classification is the process of assigning each component of the LCI inventory to one or more impact categories. For example, impact categories include human toxicity, acidification, eutrophication, and climate change.
2Characterization is the process of translating inventory data into a common metric to allow aggregation. The process generally uses equivalency factors that translate LCI data into impact descriptors. For example, climate change is denominated in units of
 -equivalents and the IPCC models have provided conversion factors that allow one to convert other GHGs into these units. For example, the global warming potential of 1 kg of methane over 100 years is 25 kg
 -equivalents and that of nitrous oxide is 298 kg
 -equivalents. Likewise, acidification is denominated in units of
 -equivalents, and human toxicity in units of benzene-equivalents.
LCIA is sometimes defined to have a third step, valuation, which involves weighting and combining the impact data derived during characterization. This step is no longer recommended under ISO standards of practice.
It is important to note that LCIA has not typically provided information about economically-relevant end-points. LCA impact assessment has evolved, but was originally developed not to tell us what sort of environmental or health impacts will occur in a specific place and time, but rather to provide information about what the impacts might potentially be. This type of LCIA is an assessment of mid-points rather than end-points. Stopping at mid-points allows LCI data to be aggregated across space and time to provide a concise measure of the environmental performance of the product system, but in doing so it gives up precision and can tell us little about actual impacts that may be relevant to our own local conditions and decisions. There has been considerable effort in recent years to move life cycle impact assessment toward measures of impact that combine midpoint and end-point (i.e., damage) indicators, particularly related to human toxicity and ecotoxicity [30]
3.5 LCA of Biorenewable Chemical Systems
Compared with the number of LCAs that have been performed for biofuels and for conventional chemicals, the number of LCA studies of biorenewable chemicals is rather limited. In addition, the majority of LCAs of biorenewable chemicals tend to focus on a few energy-related impact categories such as fossil fuel displacement and greenhouse gas emissions [20,33]
The need to be able to differentiate between candidate biorenewable chemical pathways early in the development process when data are scarce is a challenge for LCA. Indeed, the perceived need for data from existing production processes or well-defined processes in the final stages of the development process has led some to reject LCA as inadequate [34,35]
In the production of biorenewable chemicals, as with petrochemicals, there are some steps that are common to many production processes. For example, the primary feedstock for most biochemical conversion pathways will be a simple sugar such as glucose. For all processes that utilize sugar from a particular source, such as sucrose from sugar cane or glucose derived from corn starch, the life cycle inventory will be the same. A thorough life cycle inventory for the biorenewable feedstock is a good start to the overall study because from an environmental perspective, biomass production is often the dominant step in the life cycle of a biorenewable chemical [36]
If the biorenewable chemical product under study is a functional replacement for an existing petrochemical product, the inventory during the use and end-of-life stages will be very similar to its petrochemical counterpart, although adjustments may be required to account for different amounts of material used per functional unit or different end-of-life impacts. In cases where the biorenewable chemical is a direct replacement for a petrochemical, the inventories will be the same from the point in the life cycle where the replacement is made through to the end-of-life.
If the goal of the LCA is to compare a biorenewable chemical with a similar petrochemical in a limited number of categories, a relatively rough estimation of the production process inventory data may be sufficient. Because production of feedstock tends to dominate biorenewable chemical inventories, the combination of rough estimates of production data with more complete feedstock, product use and end-of-life inventories will in many cases allow the rejection or acceptance of the hypothesis that the biorenewable chemical is superior in certain environmental categories. The strength of such a conclusion can be tested using sensitivity analysis to ensure that the higher quality data available dominate the inventory. However, if one is trying to differentiate between multiple, candidate biorenewable pathways, among which the principal difference is the chemical production process, more accurate production inventory data will be required.
The synthesis of any type of chemical is a complex and diverse procedure and production data are often scarce or incomplete, even for petrochemicals that have been produced in large quantities for many years. Detailed inventories of chemical synthesis processes are expensive and time consuming, so relatively few chemical inventories exist. A variety of models have been developed for the purpose of estimating the mass and energy flows in the production of chemicals and to fill in gaps in life cycle inventories. For example, Ciba AG (now BASF Schweiz AG after a 2010 takeover by BASF) developed for internal use an LCI database library called ECOSYS, compiled from both internal process data and external data including tools for estimating missing data [37]
Process-based inventory estimation approaches, however, require a very large amount of data that often is not available during early stages of pathway development. One alternative that has been developed uses molecular structure-based models and extant LCAs of chemicals. The basis of these methods is the idea that the molecular structure of a chemical provides a wealth of information about the energy and resource requirements of its production. Molecular weight, composition, functional groups, chiral centers and similar descriptors are correlated with the specific reaction steps of the chemical synthesis and can thus provide the basis to estimate mass and energy flows during production. Wernet et al. [39,40]
For many biorenewable chemicals, during the early stages of development only rudimentary process flow sheets and partial mass and energy balances will be available. This level of life cycle uncertainty must simply be tolerated in the effort to screen candidate processes. However, another attribute that may be useful for differentiating between pathways is the environmental risk that is inherent in the intermediate and final products. Even when mass flow rates of products and wastes cannot be estimated with accuracy, pathways that involve less hazardous materials may be preferred. Properties such as toxicity, ecotoxicity, mutagenicity, and biodegradability can be estimated fairly accurately based on chemical structure [41-43]
3.6 Prospective, Consequential, and Attributional LCA
As previously mentioned, most LCAs are performed for existing products that are produced and marketed in relatively constant quantities. In this sort of LCA, the inventory and impact assessments are “snapshots” of production of a product such as a chemical at a given time. Although there are variations among plants or processes, inventory data are averages of those available for the relevant product. For example, inventory data for electricity production represent the average of the generation plants feeding the relevant electricity distribution grid. LCAs performed in this manner are termed attributional because they describe the environmental attributes of existing products or services in an average sense.
Attributional LCA is essentially an environmental accounting method that has clear parallels to the methods of managerial cost accounting used to manage production operations in most commercial firms. Attributional LCA meets the same sorts of needs as managerial accounting tools, providing at a reasonable cost a rapid measure of the performance of a product system at a specific time. Such LCA measures are as vital to environmental management as managerial accounting tools are to business management.
In contrast to the attributional approach, which focuses on the direct impact of the product life cycle activities, one may be interested in the broader impacts of a product system that occur through interactions with economic markets. This sort of analysis is known as a consequential LCA. The consequential method recognizes that industrial systems are part of larger economic systems which respond to changes in demand or supply. Economic markets respond with substitution between capital and labor, or products and services, in ways that may be quite unexpected and which have environmental and resource implications. The consequential LCA modeling approach seeks then to describe the consequences of a production decision. The relevant inventory data are marginal and the product system includes many processes that have no direct physical relationship to the product system under study. An example would be that increases in biofuel and biorenewable chemical production could drive up the price of sugar, which would lead some farmers to bypass traditional food and feed markets in order to produce sugar, and as a result farmers on the other side of the planet might then plow up grasslands or cut down forests to plant crops to fill the gap. The desire to capture such “indirect,” market-driven environmental impacts creates a need to incorporate in the analysis economic models such as partial equilibrium or computable general equilibrium models.
Theoretical dimensions of performing consequential LCA have been partially addressed [46,47]
Both attributional and consequential LCA can be useful in evaluating biorenewable chemical production systems. If one is interested in assessing the direct impacts of a biorenewable chemical, that is, to measure its “environmental footprint” in order to compare it with alternatives, an attributional LCA is appropriate—if production volumes are not expected to be large enough to significantly shift current markets for inputs or products. If instead, one is also interested in the indirect impact of biorenewable products, and production volumes are large enough to shift the markets involved, a consequential analysis is appropriate. It is important that LCA analysts and the consumers of LCA results recognize when each type of LCA is appropriate, and when interpreting results, to draw conclusions that stay within the constraints of the methodology employed. Just as erroneous conclusions are drawn by managers that mistake accounting data for economic data, LCA results are often misinterpreted by decision-makers who are unaware of the underlying assumptions of the different types of LCA.
3.7 Resource Constraints on Biorenewable Chemical Production
One of the consequences of increased production of biorenewable fuels and chemicals that is of keen interest to firms developing new biorenewable processes is how the future availability and cost of resources, particularly feedstock, will be affected by future demand. The feedstocks of most current and proposed biorenewable chemical processes are polysaccharides or sugars. World sugar prices soared to a 29-year high of nearly 30 cents a pound in early 2010 and then fell to around half that level by early summer [48]
The technological uncertainty associated with candidate biorenewable chemical production processes is naturally high due to the difficulty of predicting factors such as yields and separation costs. This technological uncertainty translates into one source of financial uncertainty. Another important source of financial uncertainty is that introduced by the volatility of sugar or other feedstock costs. This uncertainty is particularly significant because raw material cost is typically of the order of 75% of product value of commodities [49]
In addition to being vulnerable to weather and the like, the production of biomass feedstock is dependent on fertilizers, such as nitrogen, phosphorous and potassium, in order to maintain or increase crop yields. Increasingly, the fertilizers that agriculture depends upon are imported. In 2009, the United States imported more than 55% of nitrogen and 81% of potash (i.e., potassium) fertilizer used [50]
For example, modern agriculture is dependent on synthetic nitrogen fertilizer that is produced primarily from natural gas. Phosphorous fertilizer is derived from phosphate rock and current global reserves may be depleted in as little as 50–100 years [51]
The use of fertilizers in large quantities across the globe has already significantly perturbed the biogeochemical cycles of the Earth. Rockström et al. [53]
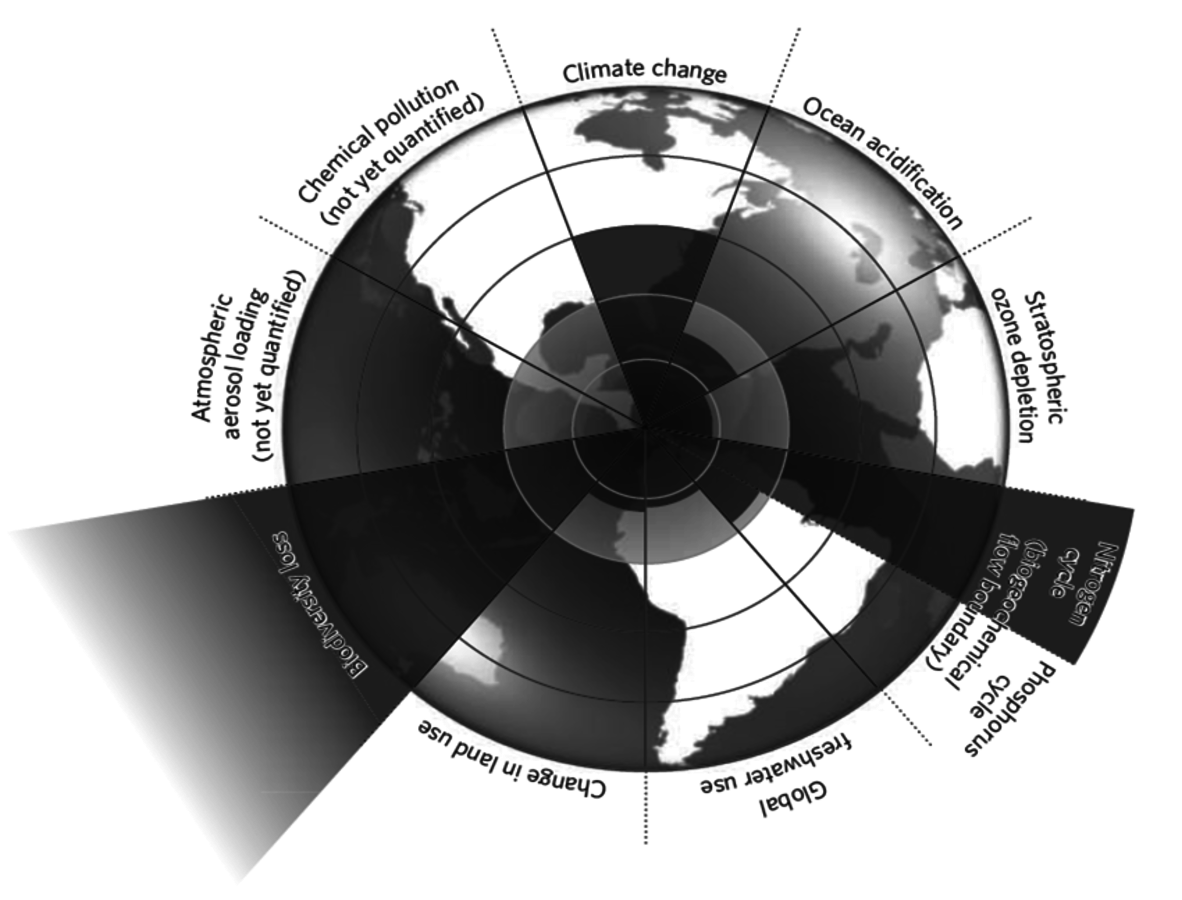
Fig. 3.4: The circular boundaries identified for nine planetary systems. The inner circular shading represents the proposed safe operating space and the wedges represent an estimate of the current position for each variable. The boundaries on the level of human interference with the nitrogen cycle, as well as the rate of biodiversity loss and climate change, are deemed to have already been violated.
Through human processes nitrogen is fixed from the atmosphere into reactive forms at a rate of around 120 million metric tons per year of N2. This large flow of reactive nitrogen fertilizes crops and then continues through other ecosystems, altering species diversity, accumulating in soils, and forming atmospheric gases that lead to pollution and climate change. Nitrogen impacts are particularly difficult to assess because nitrogen moves through the compartments of environmental systems causing a cascade of impacts [54]
Phosphorous is a mineral that is mined from locations where it has accumulated naturally through geological processes. The mined phosphate rock is used for a variety of purposes but around 90% is used as fertilizer [51]
Although the environmental consequences of fertilizer use are already serious and growing more so, there are a variety of ways to reduce the use of fertilizers in agriculture as well as technologies for recycling nutrients that are removed from agricultural fields. Fertilizer use can be made more efficient through precision application that puts the fertilizer on the field at specific times and locations to improve utilization by plants, thus requiring lower application rates per crop yield [55]
In addition to fertilizers, other limited resources may be impacted by large increases in demand for crop production to provide industrial feedstock. Many of the less productive lands that have been targeted for biomass feedstock production are marginal lands due to limited soil depth, soil quality, and rainfall. Increased biomass production will require more water for the increased crop growth because plant transpiration is directly related to carbon fixation [57]
Worldwide, agriculture is responsible for around 70% of annual freshwater withdrawals for human use. Agriculture is responsible for generating water scarcity and also for degrading high quality surface and groundwater for marginal output [59]
Resource use is closely coupled to environmental health and the impacts of resource use become more pronounced as resources become scarcer. Natural systems become less resilient and able to absorb disturbances as resource constraints bind more tightly. It is important to consider how increased use of biorenewable products will impact the supplies of resources that are critical for meeting fundamental human needs. LCA doesn't handle resource limits explicitly as it is commonly practiced because it reports resource use on a specific (i.e., per functional unit) basis, and does not account for the size, location, or nature of resource reserves.
3.8 Conclusion
LCA was developed as a tool to provide information on the full life cycle impact of our consumption choices. To accomplish this at reasonable cost, LCA takes a snap-shot of the product system at a specific time and combines a wide range of impacts into a few measures, often aggregated over time and space. LCA is not intended to be a perfect analysis that reflects the minute details of environmental processes, but rather to introduce environmental considerations in decision-making processes where they are often missing.
As we seek to address ever more complicated environmental questions, we ask more of LCA. We have extended LCA techniques and created specialized LCA tools to meet particular needs. Evaluating candidate biorenewable chemical pathways, such as is required to choose between alternative conversion processes, requires new LCA methods that can provide meaningful results despite highly uncertain process, inventory, and impact data.
LCA is a powerful tool that can inform many important decisions faced by society today. However, as we extend and diversify LCA techniques, we must also train practitioners to understand which tools are appropriate for which questions. Along with our LCA results we must also carefully communicate their limitations and proper use in order to enable society to make better choices and move toward a more sustainable future.
Acknowledgments
This material is based upon work supported, in part, by the National Science Foundation under Award No. EEC-0813570. Any opinions, findings, and conclusions or recommendations expressed in this material are those of the author and do not necessarily reflect the views of the National Science Foundation.
[1] C.H. Christensen, J. Rass-Hansen, J. RH., Marsden J., M. J.. The Renewable Chemicals Industry ChemSusChem 1: 283-289 (2008): 283-289.
[2] B.G. Hermann, K. Blok, K. B.. Producing Bio-Based Bulk Chemicals Using Industrial Biotechnology Saves Energy and Combats Climate Change Environmental Science and Technology 41: 7915-7921 (2007a): 7915-7921.
[3] J. Haveren, Scott van, S. v.. Bulk Chemicals from Biomass Biofuels, Bioproducts & Biorefining 2 (2008): 41-57.
[4] A.J. Ragauskas, C.K. Williams, C. W., Davison C.K., D. C., B.H. Davison, B. D., Britovsek B.H., B. B., G. Britovsek, G. B., Cairney G., C. G., J. Cairney. The Path Forward for Biofuels and Biomaterials Science 311: 484-489 (2006): 484-489.
[5] J.J. Bozell, G.R. Peterson. Green Chemistry 12: 539-554 (2010): 539-554.
[6] G. Centi, P. Lanzafame, P. L.. Analysis of the Alternative Routes in the Catalytic Transformation of Lignocellulosic Materials Catalysis Today 167: 14-30 (2010): 14-30.
[7] D.R. Dodds, R.A. Gross. Chemicals from Biomass Science 318: 1250-1251 (2007): 1250-1251.
[8] M. Wellisch, G. Jungmeier, G. J., Karbowski G., K. G.. Biofuels, Bioproducts and Biorefining 4: 275-286 (2010): 275-286.
[9] B.J. Nikolau, M.A. Perera, M. P., Brachova M.A.. Platform Biochemicals for a Biorenewable Chemical Industry The Plant Journal 54: 536-545 (2008): 536-545.
[10] Y.-C. Lin, G.W. Huber. The Critical Role of Heterogeneous Catalysis in Lignocellulosic Biomass Conversion Energy and Environmental Science 2: 68-80 (2009): 68-80.
[11] B.G. Hermann, M.K. Patel. Applied Biochemistry and Biotechnology 136: 361-388 (2007b): 361-388.
[12] C.L. Henn, J.A. Fava. Life Cycle Analysis and Resource Management. In: Environmental Strategies Handbook Ed. by R.V. Kolluru. New York NY: McGraw-Hill, Inc, 1994. .
[13] R.G. Hunt, W.E. Franklin. LCA—How we came about International Journal of Life Cycle Assessment 1: 4-7 (1996): 4-7.
[14] Environmental Management. Life Cycle Assessment. Principles and Framework.. Environmental Management. Life Cycle Assessment. Principles and Framework.. Geneva, 2006
[15] Environmental Management. Life Cycle Assessment. Requirements and Guidelines. Environmental Management. Life Cycle Assessment. Requirements and Guidelines. Geneva, 2006
[16] J.A. Fava, R.F. Weston, R. W., Consoli R.F., C. R., F. Consoli, F. C.. A Conceptual Framework for Life-Cycle Impact Assessment. Pensacola, FL: Society of Environmental ToxicologyChemistry, 1992
[17] G.A. Keoleian, D. Menery. Life Cycle Design Guidance Manual: Environmental Requirements and the Product System, Risk Reduction Engineering Laboratory. Cincinnati OH: U.S. Environmental Protection Agency, 1993
[18] B.W. Vignon, D.A. Tolle, D. T., Cornaby D.A., C. D., B.W. Cornaby, B. C., Latham B.W.. Life-Cycle Assessment: Inventory Guidelines and Principles (EPA/600/R-92/245). Cincinnati OH: Risk Reduction Engineering Laboratory: U.S. Environmental Protection Agency, 1993
[19] M. Akiyama, T. Tsuge, T. T.. Environmental Life Cycle Comparison of Polyhydroxyalkanoates Produced from Renewable Carbon Resources by Bacterial Fermentation Polymer Degradation and Stability 80: 183-194 (2003): 183-194.
[20] R.P. Anex, A.L. Ogletree. Life-Cycle Assessment of Energy-Based Impacts of a Biobased Process for Producing 1,3-Propanediol. In: Feedstocks for the Future: Renewables for the Production of Chemicals and Materials Ed. by J. Bozell, M. Patel. Washington D.C.: American Chemical Society, 2006. 222-238.
[21] C. Liptow, A.-M. Tillman. Comparative Life Cycle Assessment of Poly- ethylene Based Sugar Cane and Crude Oil. phdthesis. , 2009
[22] E.T.H. Vink, K.R. Rabago, K. R., Glassner K.R.. Applications of Life Cycle Assessment to NatureworksTM Poly-Lactide (PLA) Production Polymer Degradation and Stability 80: 403-419 (2003): 403-419.
[23] F. Cherubini, G. Jungmeier. LCA of a Biorefinery Concept Producing Bioethanol, Bioenergy, and Chemicals from Switchgrass International Journal of Life Cycle Assessment 15: 53-66 (2010): 53-66.
[24] Franklin Associates Ltd. () Resource and Environmental Profile Analysis of Polyethylene and Unbleached Paper Grocery Sacks.
[25] J.S. Cooper. Specifying Functional Units and Reference Flows for Comparable Alternatives International Journal of Life Cycle Assessment 8: 337-349 (2003): 337-349.
[26] B.P. Weidema. Multi-User Test of the Data Quality Matrix for Product Life Cycle Inventory Data International Journal of Life Cycle Assessment 3: 259-265 (1998): 259-265.
[27] R. Frischknecht, N. Jungbluth, N. J., Althaus N., A. N., H.J. Althaus, H. A., Doka H.J., D. H., G. Doka. Overview and Methodology. Duebendorf, Switzerland: Swiss Centre for Life Cycle Inventories, 2007
[28] Ethanol Can Contribute to Energy and Environmental Goals. Ethanol Can Contribute to Energy and Environmental Goals Science 311: 506-508 (2006): 506-508.
[29] K. Kodera () Analysis of Allocation Methods of Bioethanol LCA.
[30] J.C. Bare, P. Hofstetter, P. H., Pennington P.. Midpoint Versus Endpoints: The Sacrifices and Benefits International Journal of Life Cycle Assessment 5: 319-326 (2000): 319-326.
[31] O. Jolliet, M. Margni, M. M., Charles M., C. M., R. Charles, R. C.. IMPACT 2002+: A New Life Cycle Impact Assessment Methodology International Journal of Life Cycle Assessment 8: 324-330 (2003): 324-330.
[32] M. Goedkoop, R. Heijungs, R. H., Huijbregts R., H. R., A. Huijbregts () A Life Cycle Impact Assessment Method which Comprises Harmonized Category Indicators at the Midpoint and the Endpoint Level. Report 1: Characterization.
[33] V. Dornburg, I. Lewandowski, I. L.. Comparing Land Requirements, Energy Savings, and Greenhouse Gas Emissions Reduction of Bio- Journal of Industrial Ecology 7: 93-116 (2003): 93-116.
[34] A. Gehin, P. Zwolinski, P. Z.. Towards the Use of LCA During the Early Design Phase to Define EOL Scenarios. Advances in Life Cycle Engineering for Sustainable Manufacturing Businesses.., 2007
[35] D. Millet, L. Bistagnino, L. B., Lanzavecchia L., L. L.. Does the Potential of the Use of LCA Match the Design Team Needs? Journal of Cleaner Production 15: 335-346 (2007): 335-346.
[36] R. Hatti-Kaul, U. Toernvall, U. T., Gustafsson U.. Trends in Biotechnology 25: 119-124 (2007): 119-124.
[37] R. Bretz, P. Rankhauser. Screening LCA for Large Numbers of Products: Estimation Tools to Fill Data Gaps International Journal of Life Cycle Assessment 1: 139-146 (1996): 139-146.
[38] A.D. Curzons, C. Jimenez-Gonzalez, C. JG., Duncan C., D. C.. Fast Life Cycle Assessment of Synthetic Chemistry (FLASC) Tool International Journal of Life Cycle Assessment 12: 272-280 (2007): 272-280.
[39] Molecular-Structure-Based Models of Chemical Inventories Using Neural Networks. Molecular-Structure-Based Models of Chemical Inventories Using Neural Networks Environmental Science and Technology 42: 6717-6722 (2008): 6717-6722.
[40] G. Wernet, S. Papadokonstantakis, S. P., Hellweg S.. Bridging Data Gaps in Environmental Assessments: Modeling Impacts of Fine and Basic Chemical Production Green Chemistry 11: 1826-1831 (2009): 1826-1831.
[41] M. Pavan, A.P. Worth. Review of Estimation Models for Biodegradation QSAR & Combinatorial Science 27: 32-40 (2007): 32-40.
[42] J.W. Raymond, T.N. Rogers, T. R., Shonnard T.N.. A Review of Structure-Based Biodegradation Estimation Methods Journal of Hazardous Materials B84: 189-215 (2001): 189-215.
[43] A.C. White, R.A. Mueller, R. M., Gallavan R.A., G. R.. A Multiple in Silico Program Approach for the Prediction of Mutagenicity from Chemical Structure Mutation Research 539: 77-89 (2003): 77-89.
[44] J. Gao, L.B. Ellis, L. E.. The University of Minnesota Pathway Prediction System: Multi-Level Prediction and Visualization Nucleic Acids Research 39: W406-411 (2011): W406-411.
[45] H. Sugiyama, U. Fischer, U. F., Hungerbühler U.. Decision Framework for Chemical Process Design Including Different Stages of Environmental, Health, and Safety Assessment American Institute of Chemical Engineers 54: 1037-1053 (2008): 1037-1053.
[46] T. Ekvall, B.P. Weidema. System Boundaries and Input Data in Consequential Life Cycle Inventory Analysis International Journal of Life Cycle Assessment (2004):.
[47] B.A. Sanden, M. Karlstom. Positive and Negative Feedback in Consequential Life-Cycle Assessment Journal of Cleaner Production 15: 1469-1481 (2007): 1469-1481.
[48] M. McConnell, E. Dohlman, E. D.. World Sugar Price Volatility Intensified by Market and Policy Factors Amber Waves 8: 28-35 (2010): 28-35.
[49] L.R. Lynd, C.E. Wyman, C. W.. Biocommodity Engineering Biotechnology Progress 15: 777-793 (1999): 777-793.
[50] USDA () U.S. Fertilizer Import/Export: Summary of the Data Findings.
[51] D. Cordell, J.-O. Drangert, JO. D.. The Story of Phosphorus: Global Food Security and Food for Thought Global Environmental Change (2009):.
[52] NRC. Biobased Industrial Products: Research and Commercialization Priorities. Washington DC: National Academies Press, 2000
[53] J. Rockström, W. Steffen, W. S., Noone W., N. W., K. Noone, K. N., Persson K., P. K., A. Persson, A. P., F.S. Chapin A., F.C. A., III F.S. Chapin, I. F.C., Lambin III, L. I., E.F. Lambin, E. L., Lenton E.F., L. E., T.M. Lenton, T. L., Scheffer T.M., S. T., M. Scheffer, M. S., Folke M., F. M.. A Safe Operating Space for Humanity Nature 461: 472-475 (2009): 472-475.
[54] J.N. Galloway, J.D. Aber, J. A., Erismann J.D., E. J., J.W. Erismann, J. E.. The Nitrogen Cascade BioScience 54: 341-356 (2003): 341-356.
[55] K.G. Cassman. Ecological Intensification of Cereal Production Systems: Yield Potential, Soil Quality, and Precision Agriculture Proceedings of the National Academy of Sciences 96: 5952-5959 (1999): 5952-5959.
[56] R.P. Anex, L.R. Lynd, L. L., Laser L.R., L. L.. Potential for Enhanced Nutrient Cycling Through Coupling of Agricultural and Bioenergy Systems Crop Science 47: 1327-1335 (2007): 1327-1335.
[57] T.R. Sinclair. Taking Measure of Biofuel Limits American Scientist 97: 400-407 (2009): 400-407.
[58] United Nations () Water Scarcity.
[59] FAO () Coping with Water Scarcity.